Super Quick RAMM Hacks: summary dataset insights from RAMM Map
This article is part of the Super Quick RAMM Hacks series! In just one or two minutes, you can discover helpful bite-sized tips and tricks to optimise your RAMM experience and workflow.
Today, you will learn how to get some rapid summary statistics from any datasets you have loaded onto your RAMM Map.
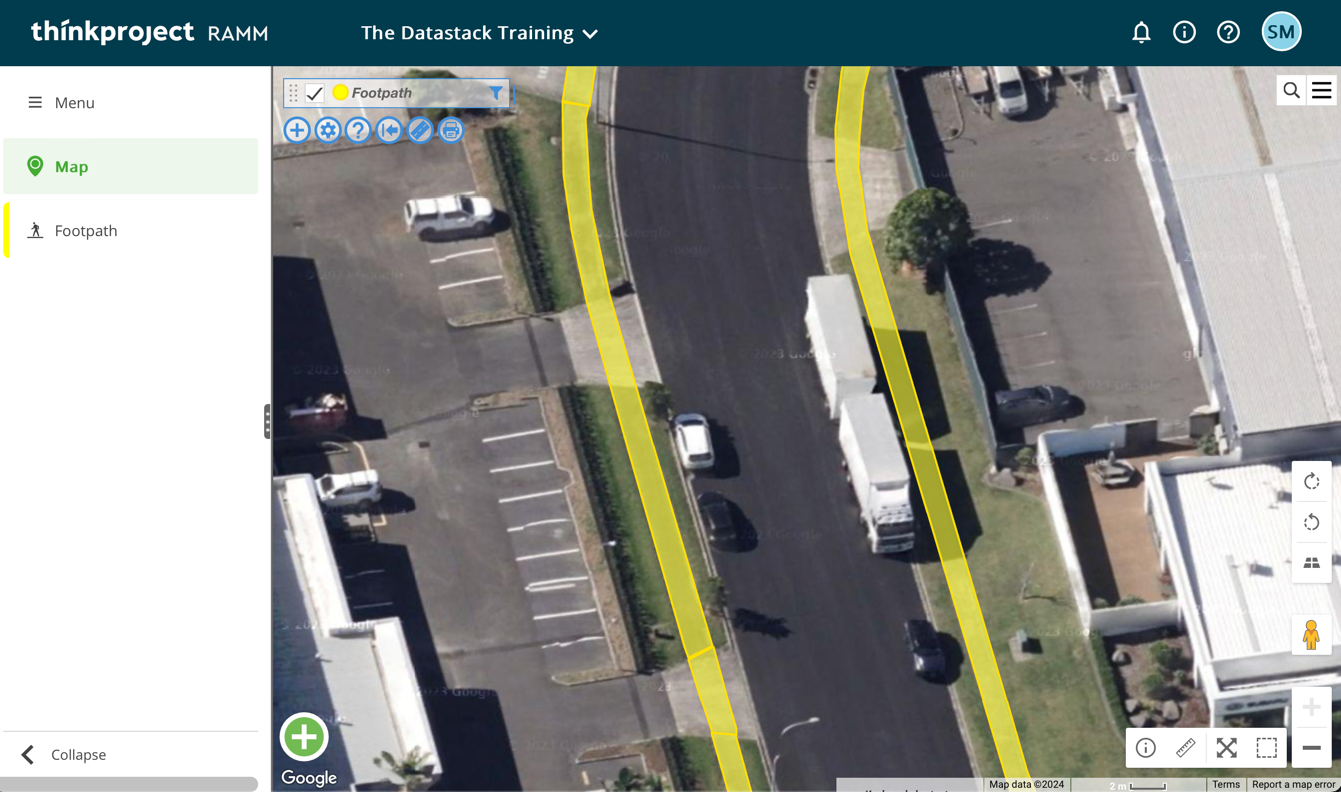
To get things started in RAMM, I opened the footpath table to add it to the RAMM Map. In the screenshot, you can see a zoomed-in view of some footpath assets displayed in a bright and colourful yellow to make them easy to see.
Footpath assets as visualised in the RAMM Map.
With that data added to the map, you want to click on the layer name in the top left of the map window, and In the subsequent menu that appears, select the Show Summary option.
Accessing the Show Summary option through the layer menu.
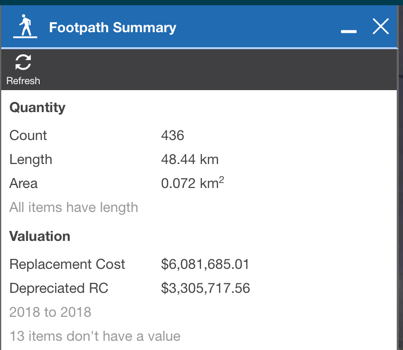
The summary window will then open (in this case, labelled Footpath Summary) to show you a series of summary statistics, giving some fundamental insights into the dataset. For example, in the screenshot below, there are 436 footpaths, with a length of 48.44km (with a note also included to say that all the assets have a length populated.)
Summary statistics for the footpath dataset.
Some valuation figures are also shown, including the replacement cost, depreciated replacement cost and valuation data range. It has also told me that thirteen items (assets) are yet to be valued.
But wait, this little feature gets even better! The statistics you see are based on any filters you apply to the dataset. This makes it even easier to drill down on a specific subset of data you need.
Let's say we want to get summary statistics for just one footpath. No problem - we set a filter to reduce the dataset to just one record.
Setting a filter on the footpath table.
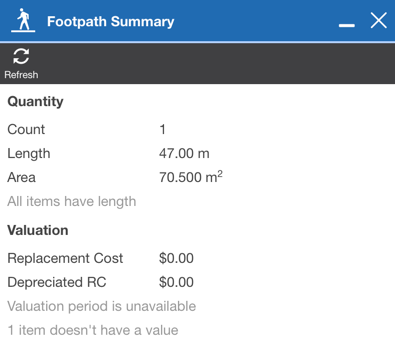
When we refresh the summary statistics, they have been adjusted to reflect the filtered dataset.
The refreshed summary statistics based on the applied filter.
And there you have it - a speedy and handy way to get basic summary stats of your data. Stay tuned for more articles in the Super Quick RAMM Hacks series.


