Minimise your innovation
Today I am sharing with you the slides from my talk called Minimise your innovation.
I have had a lot of fun delivering this talk at a few different conferences over the last nine months. And it includes a bit of everything in it. From a slightly tongue-in-cheek look at innovation, to Occam’s Razor, Galls Law, a Tesla, a Coffee mug, a Raspberry Pi and the innovation flashiness index.
Oh, and there are also some actual infrastructure asset management case studies mixed in there as well. These are all built around roading asset and network management projects, that do cool things with the RAMM system, by leveraging user defined tables (UDTs) and SQL code.
I have included a transcript with the slides, so it will read closely to how it sounded when delivered live at the events.
So grab a coffee and enjoy.
On to the presentation…
I do not like the word innovation.
I know what you are thinking. That’s a slightly problematic take to have… given that I am about to mention the word innovation approximately 283 times by the end of this talk.
But that was how I felt about the word innovation, and how it was used within the industry, for the longest of times.
The whole innovation thing felt a bit like asking someone what they do for a living, and they say, “I work in IT”.
What does that even mean? It could be in reference to one of hundreds of different diverse roles, so it doesn’t really tell you anything.
And it was the same thing for innovation.
It felt like the word was dropped into marketing collateral, bids, cv’s, and reports, often just as this standalone word, without any real tether to an existing concrete idea or solution.
So when it came to innovation, it became very apparent the thing often missing is context. This is because the word innovation will mean many different things to different people.
What's the first thing you think of when I say the word innovation? Perhaps something like this….
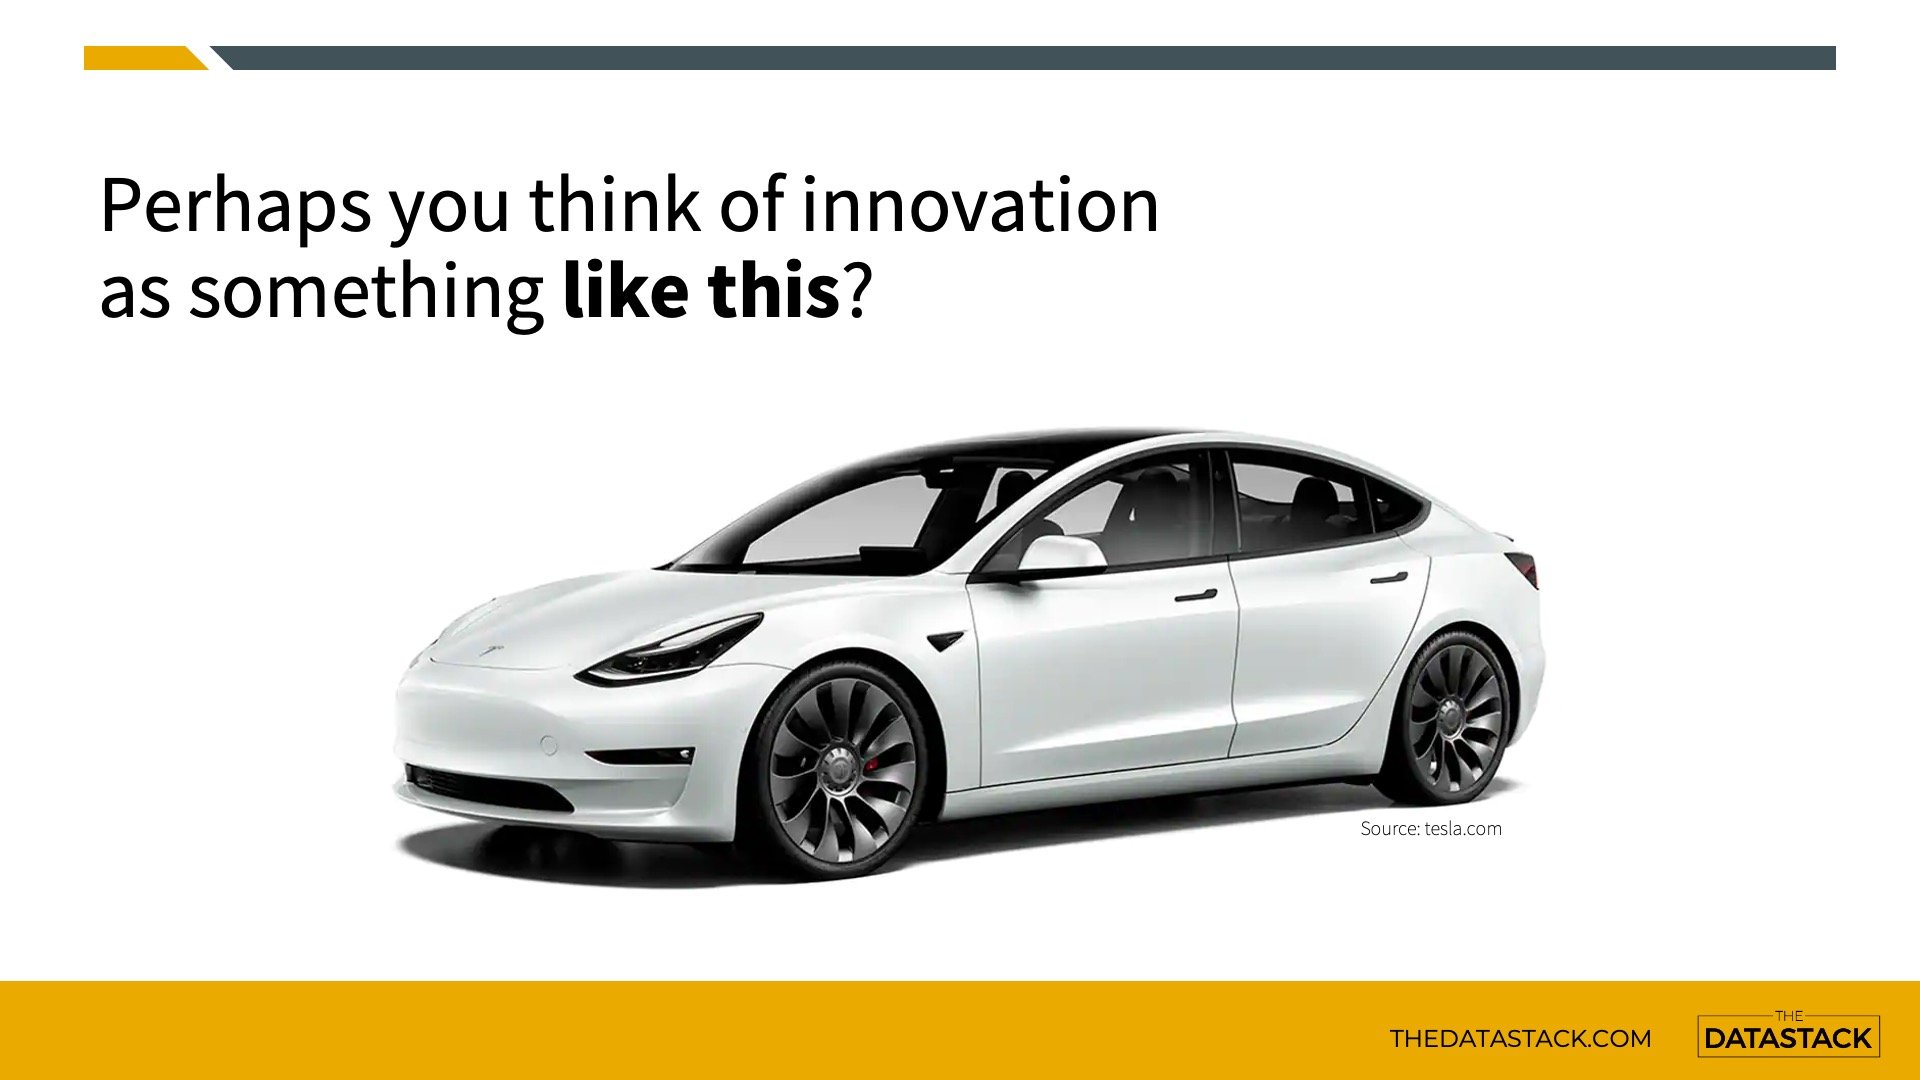
A Tesla vehicle! Arguably a modern-day innovation that you can see driving around on the roads today.
Or perhaps you think of innovation as being something truly world-changing.
Truly transformational.
Something like this….
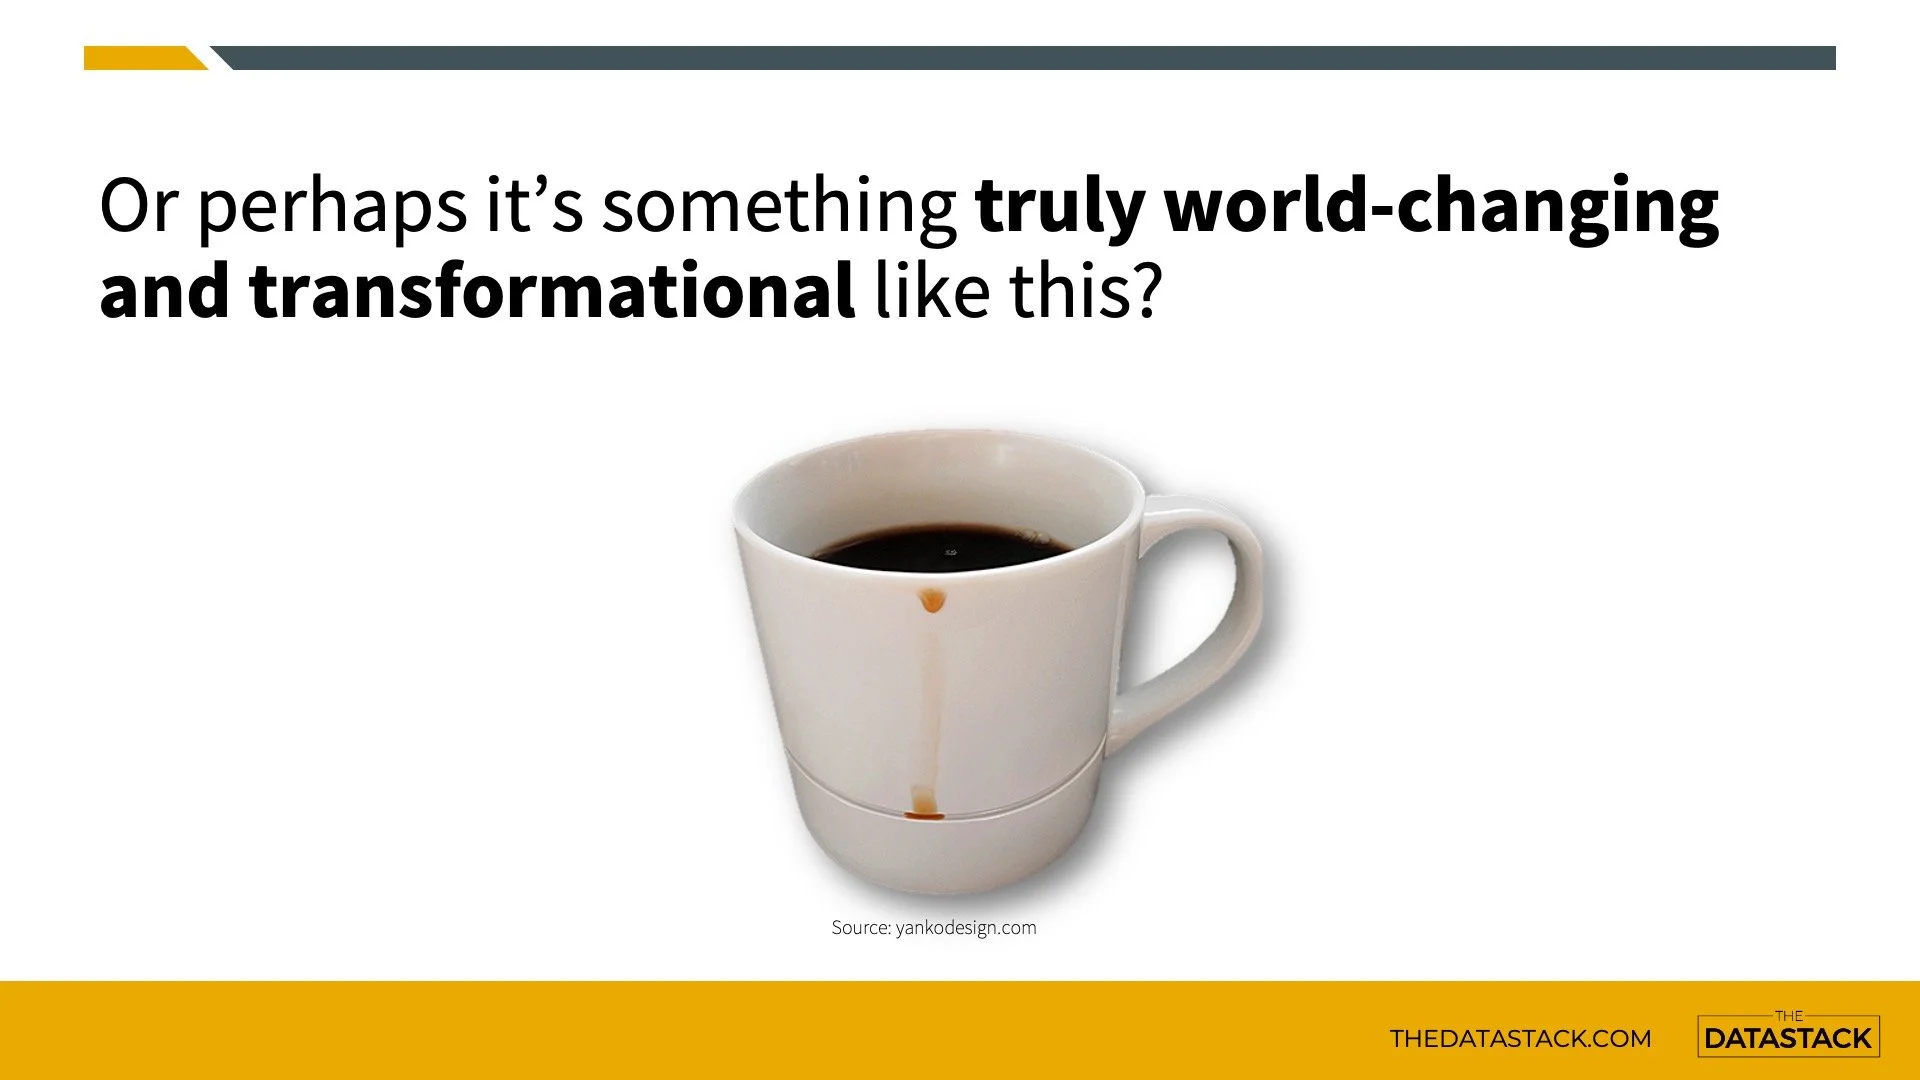
I know right.
It’s a coffee mug that catches the drips that run down the side.
It catches the drips that run down the side.
As someone who is caffeinated at least 23 hours a day, this is some life-changing stuff.
So having mulled over the use of the term innovation for some time, I reconciled my differences with the word, by thinking of it as this idea of solving an inefficiency or creating value… all within the context of where the word is being used.
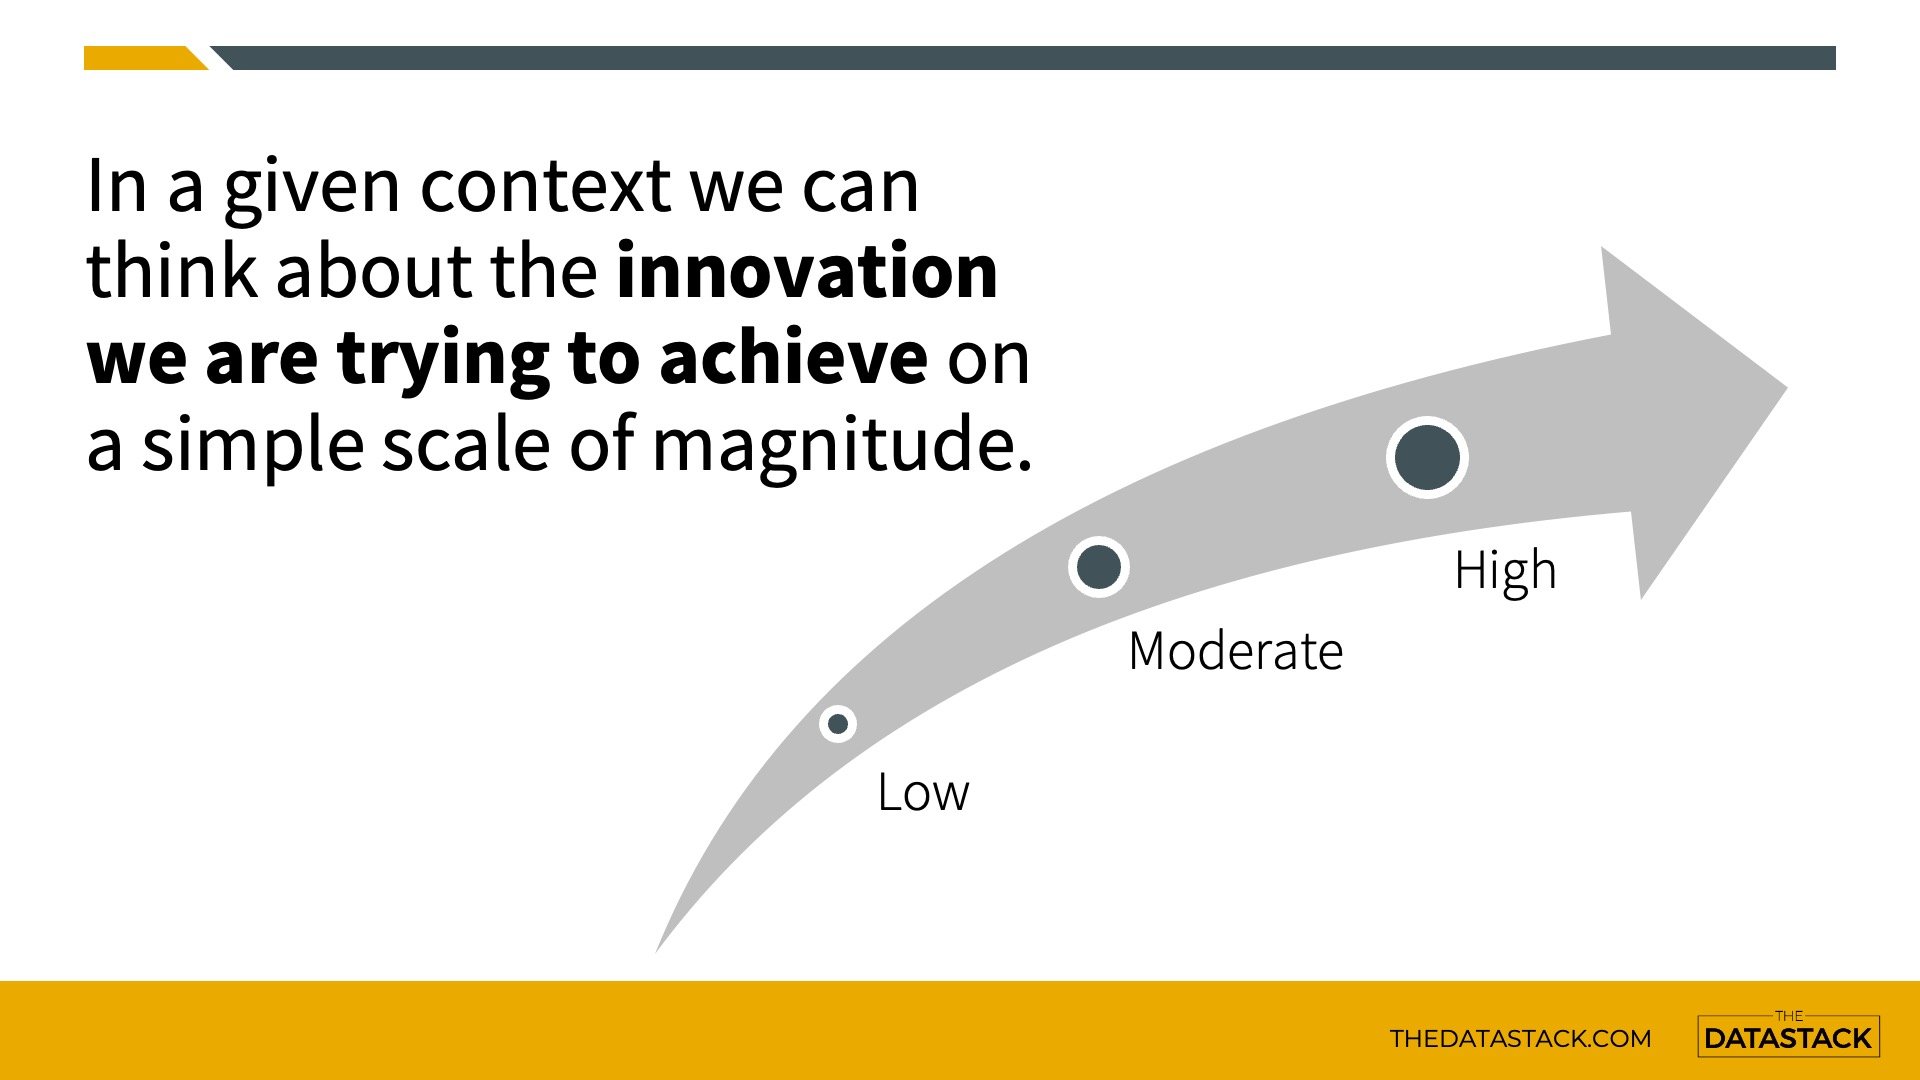
And for our own projects and problems, we can think about innovations on a really simple scale of magnitude. At the low end, we have more micro-level tweaks and improvements. And as we move through to the higher end of the scale, this starts being the really big picture stuff in terms of new products and systems and things of that nature.
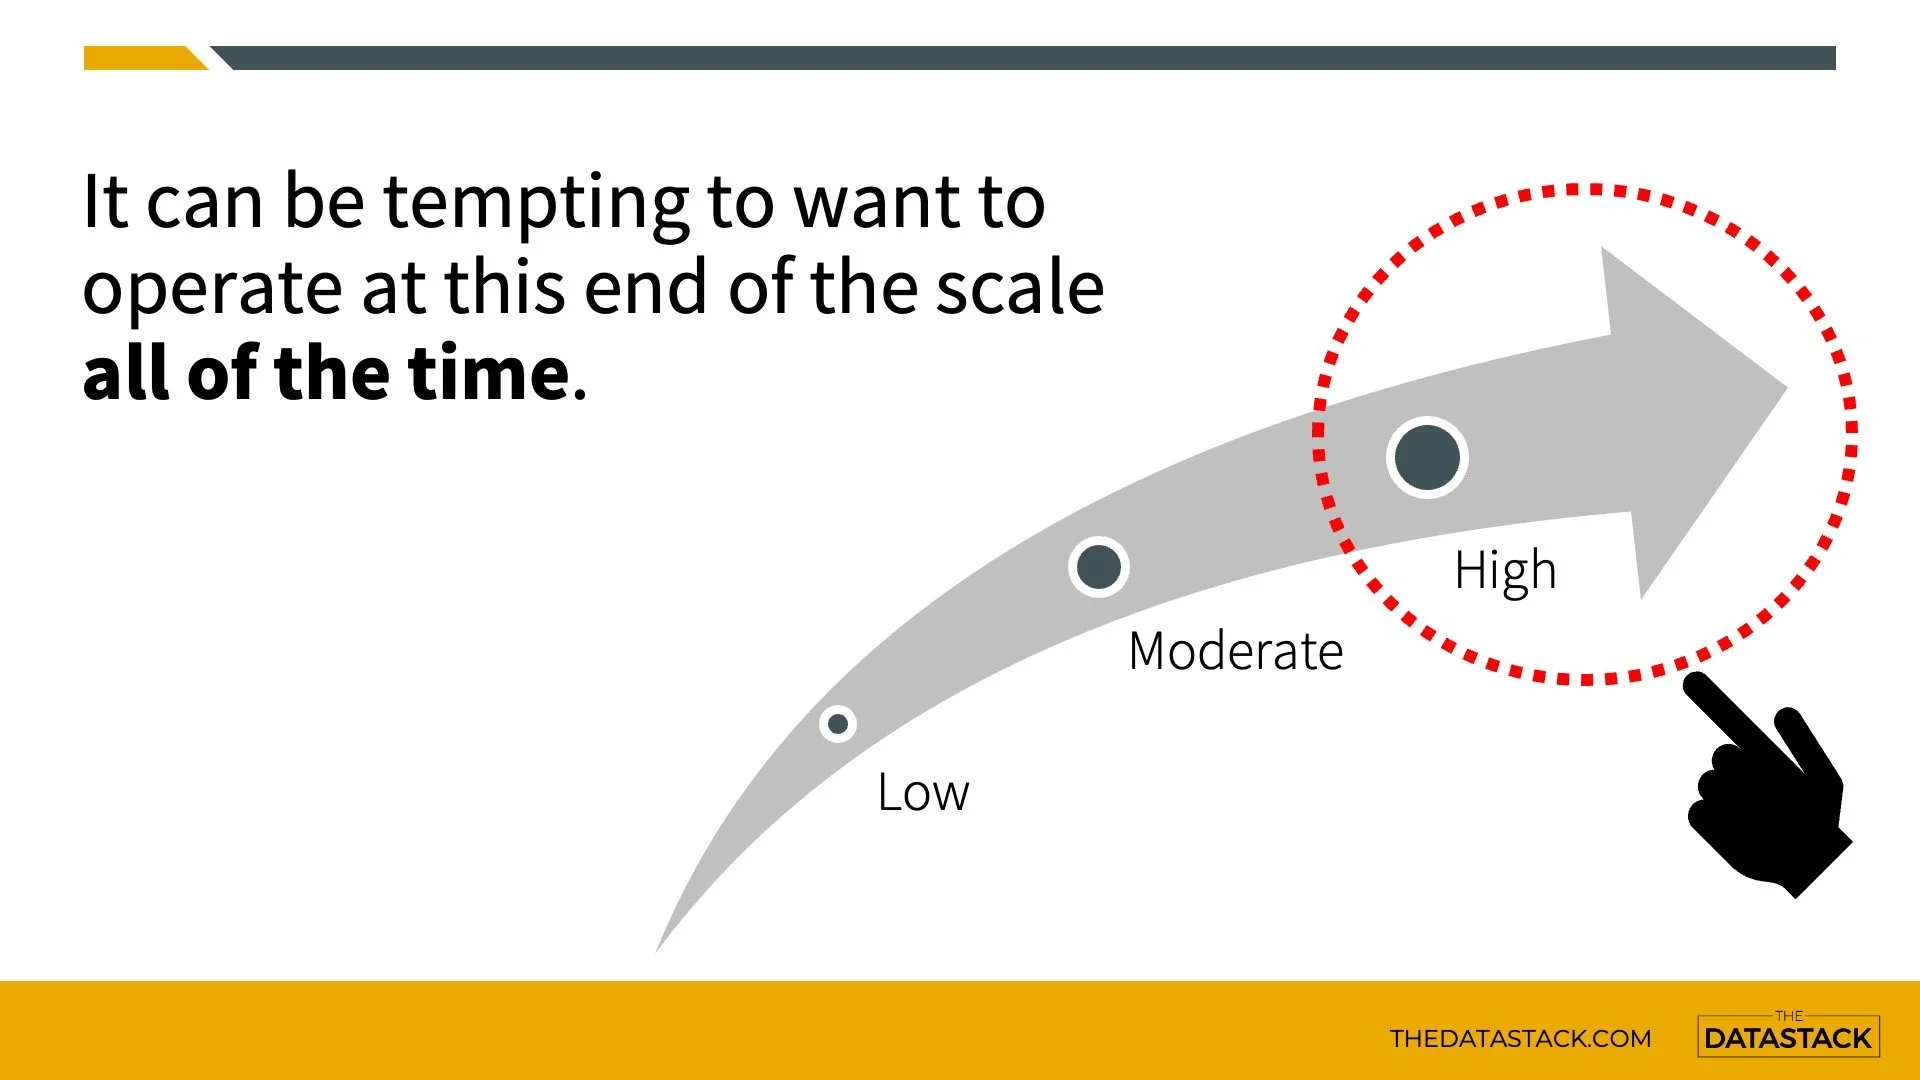
The thing is, it can be really tempting to want swim in the high end of the pool all of the time. The thinking is often that this end is better.
It’s fun.
It’s exciting
It’s where legacies will be made.
And it’s these factors that can sometimes lead to less than desirable outcomes.
Now to help quantify the impacts of these factors, I have invested countless hours doing extensive research on this topic, and I have come up with this.
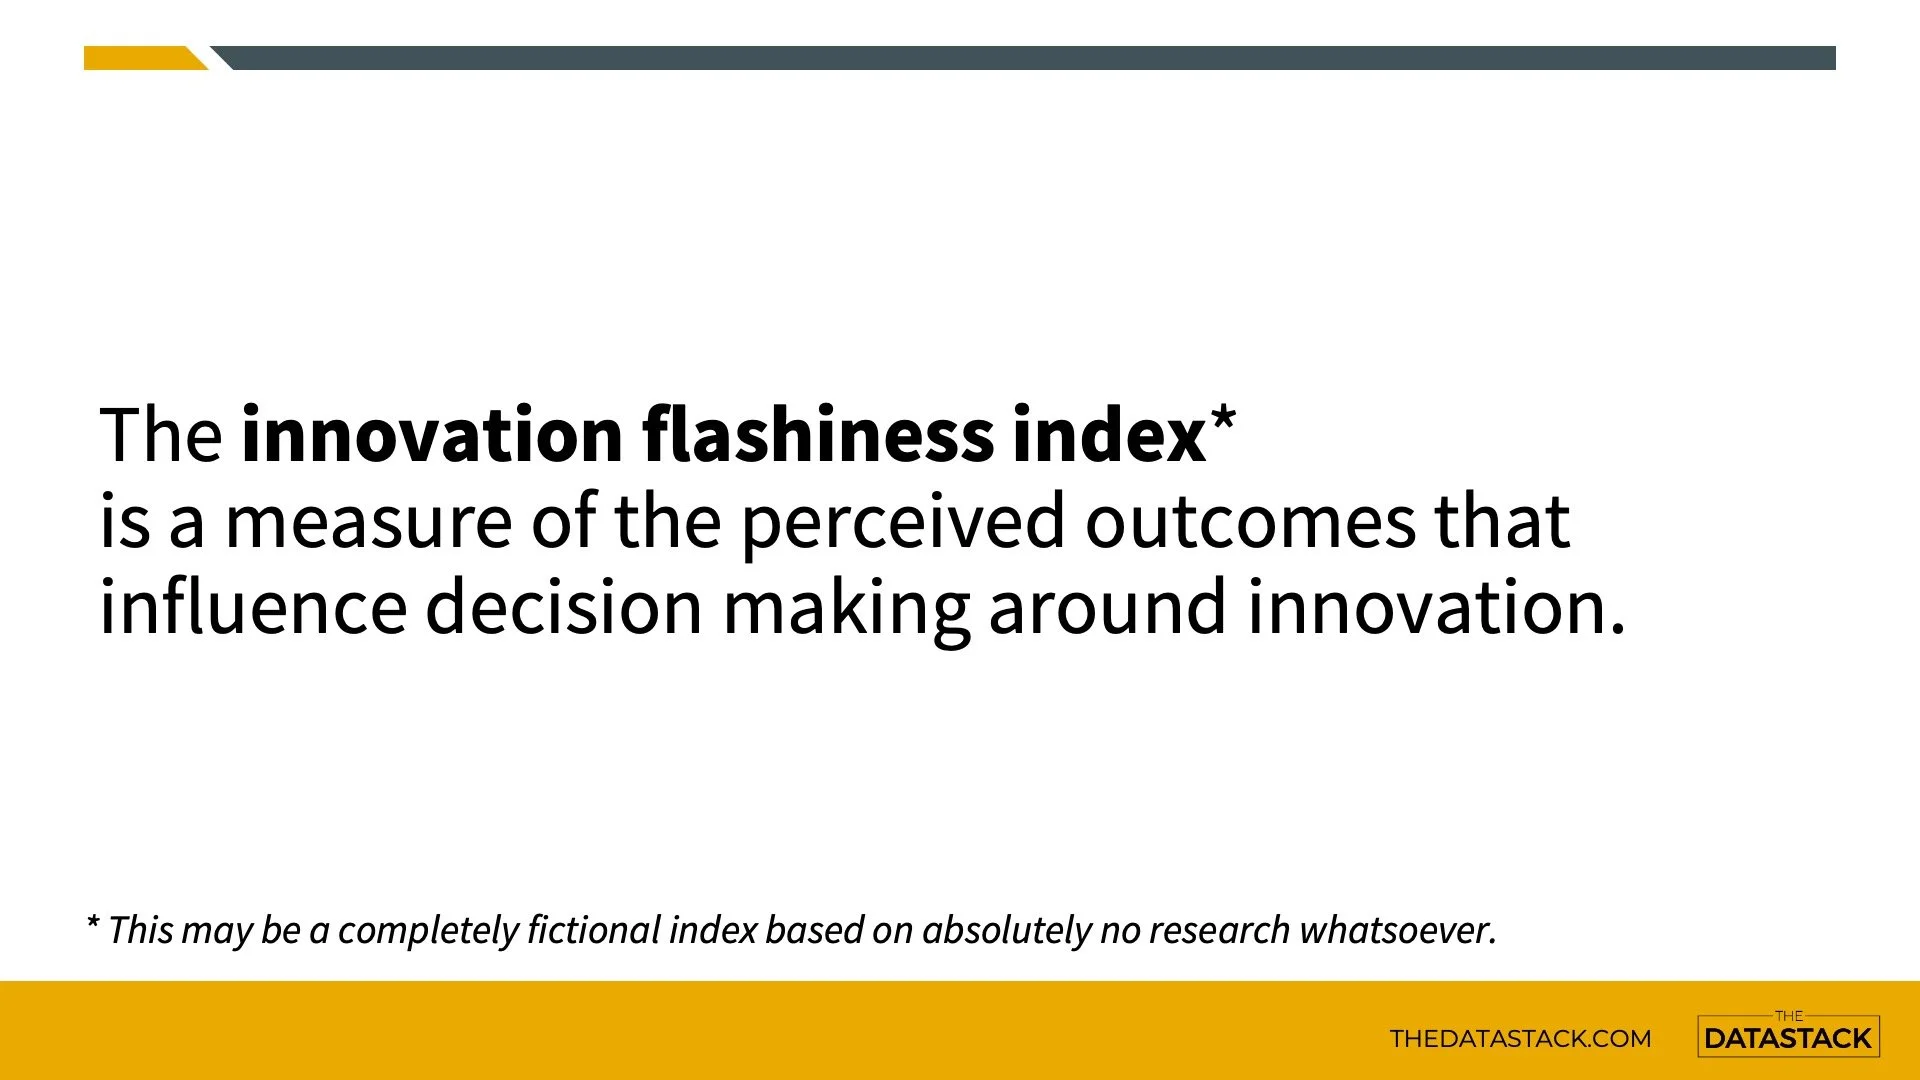
The innovation flashiness index.
This measures all the factors and perceived outcomes that influence our decision-making around innovative solutions.
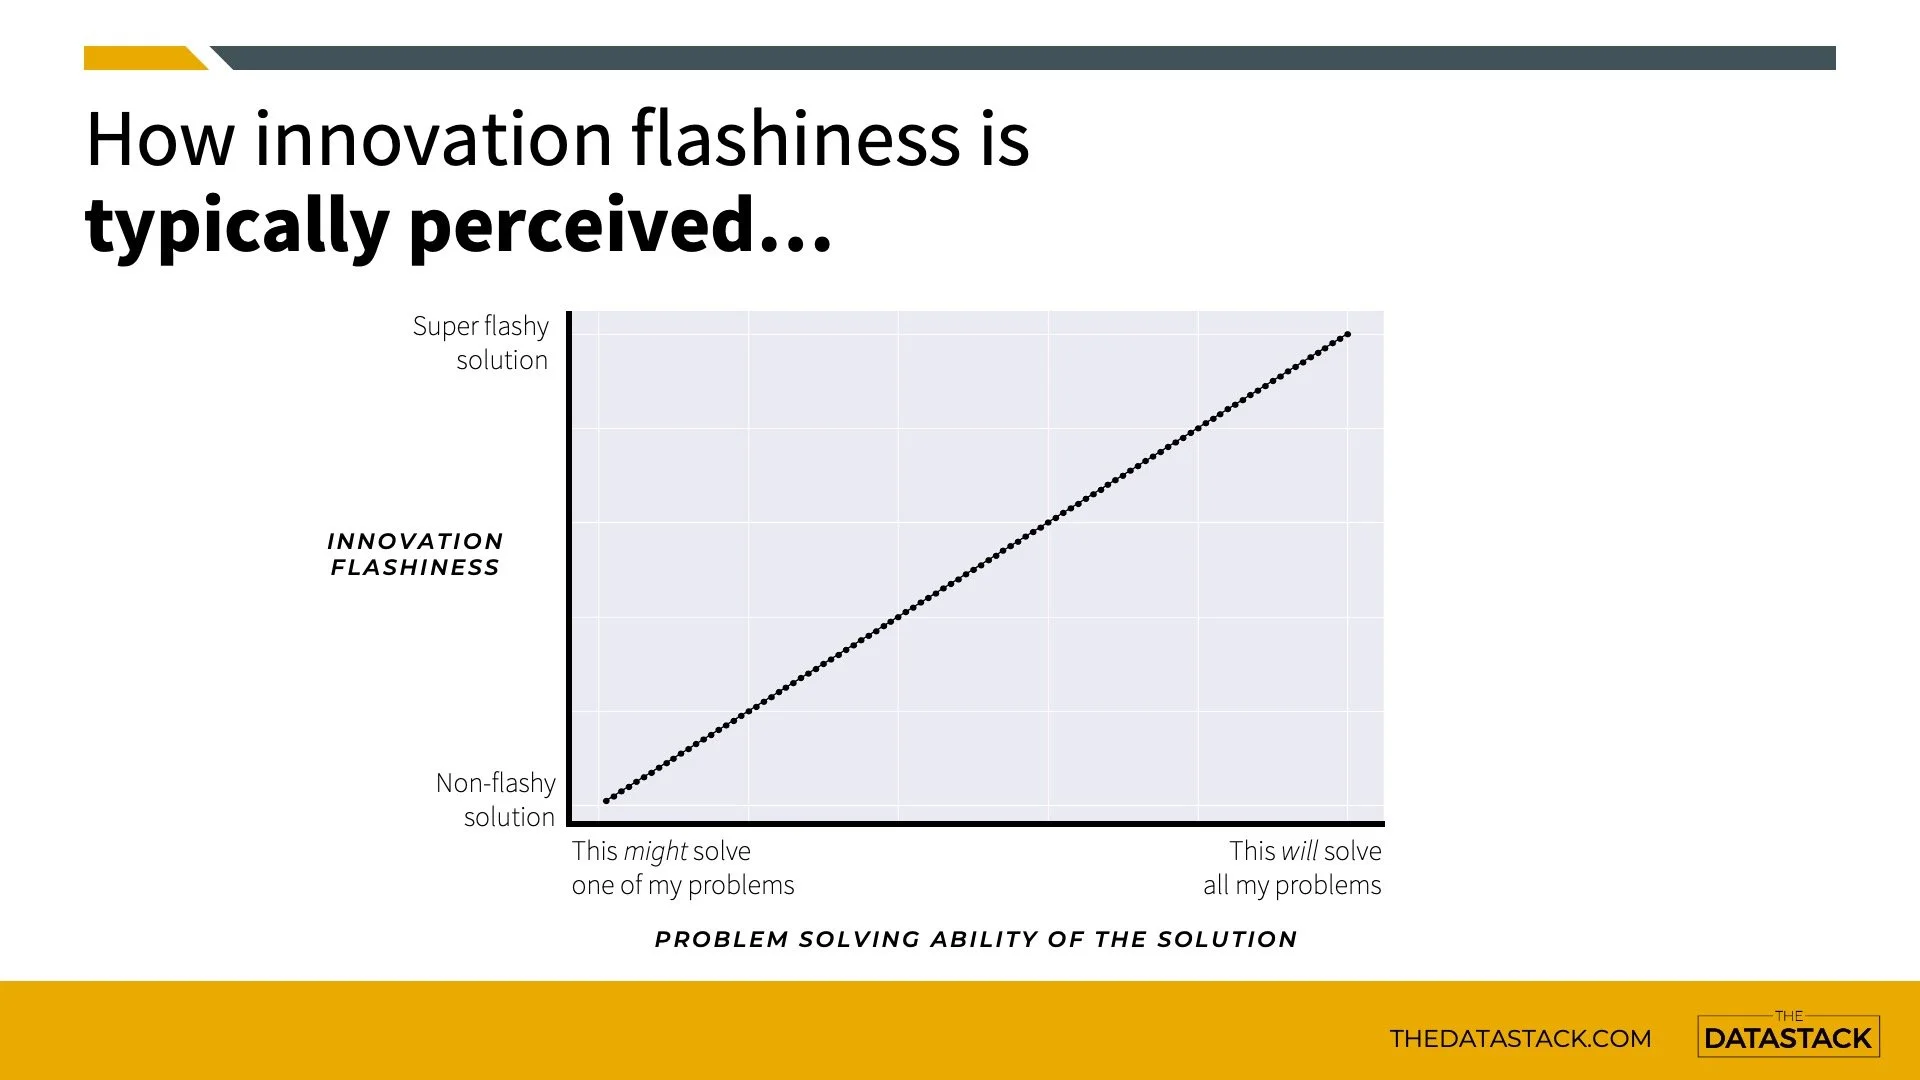
People will often think that the bigger and flashier our solution gets, the more of our problems that will be solved.
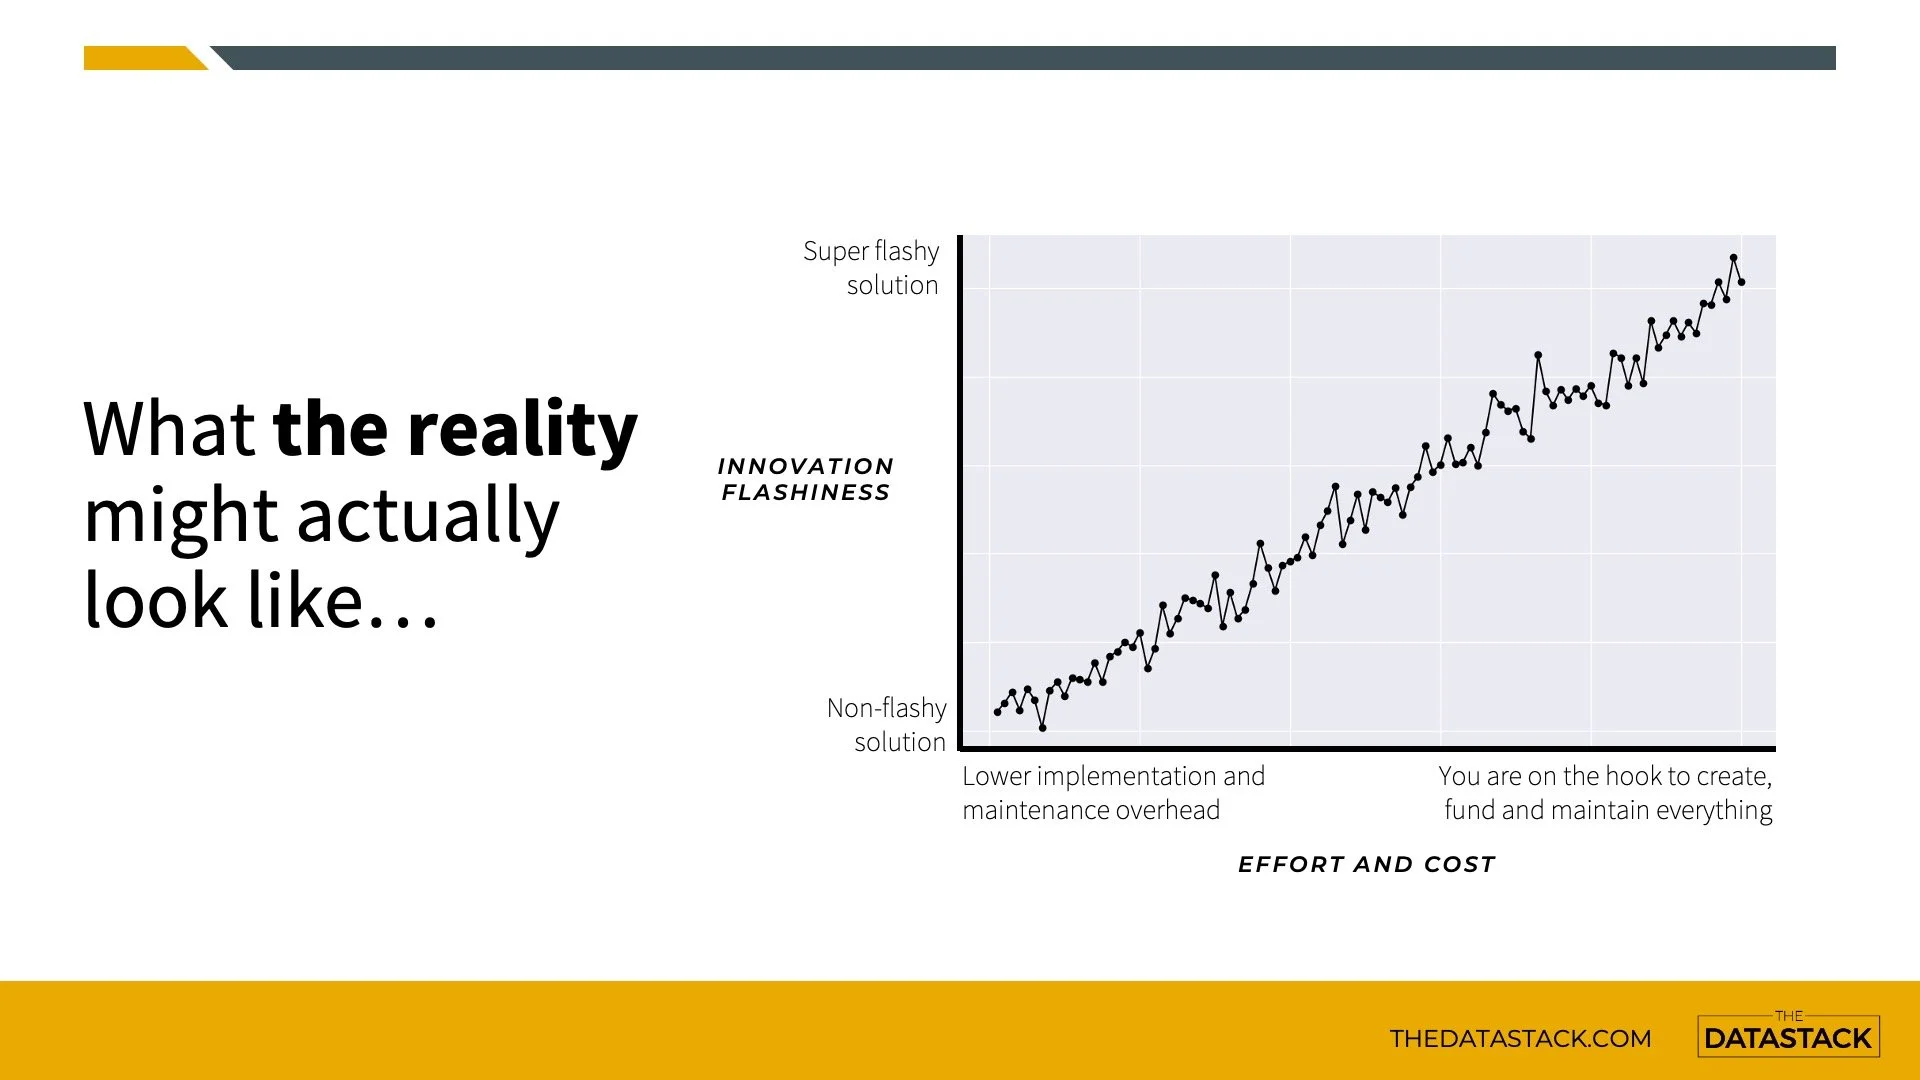
The reality is that trying to maximise our innovation can look more like this.
That non-flashy solution, which still solves the problem, has the benefits of lower costs, resource needs, and maintenance overhead.
And as we move up the flashiness scale, the more and more we are on the hook for building… and maintaining… and funding everything that we create or introduce.

And there are some excellent theories and principles out there, to support this idea of keeping things simple rather than going for something that is super flashy.
Occam’s Razor. If you are weighing up between a simple solution and a complex solution, the simple one is often the best.
This is a very paraphrased version of Occams Razor, but it captures the essence of simplicity over complexity.
Gall’s Law is the idea that a complex system that works will have originally come from a simple system that worked.
And the law goes on to say that you can’t just start by successfully designing a complex system – it has to be simple first and then built up from there.
Minimum Viable Scope or Humble Scope
This is an idea I heard on a podcast, and I traced it to Peter Wang, who said you should build something useful, but at some point, you should stop trying to build everything. At that stage, your focus should shift to creating interfaces to other existing things that solve your remaining problems.

So I posit to you this idea of minimum innovation and the philosophy behind it.
Minimum innovation is the simplest sustainable thing we can add, that will create disproportionate value. Let’s break that down a little bit.
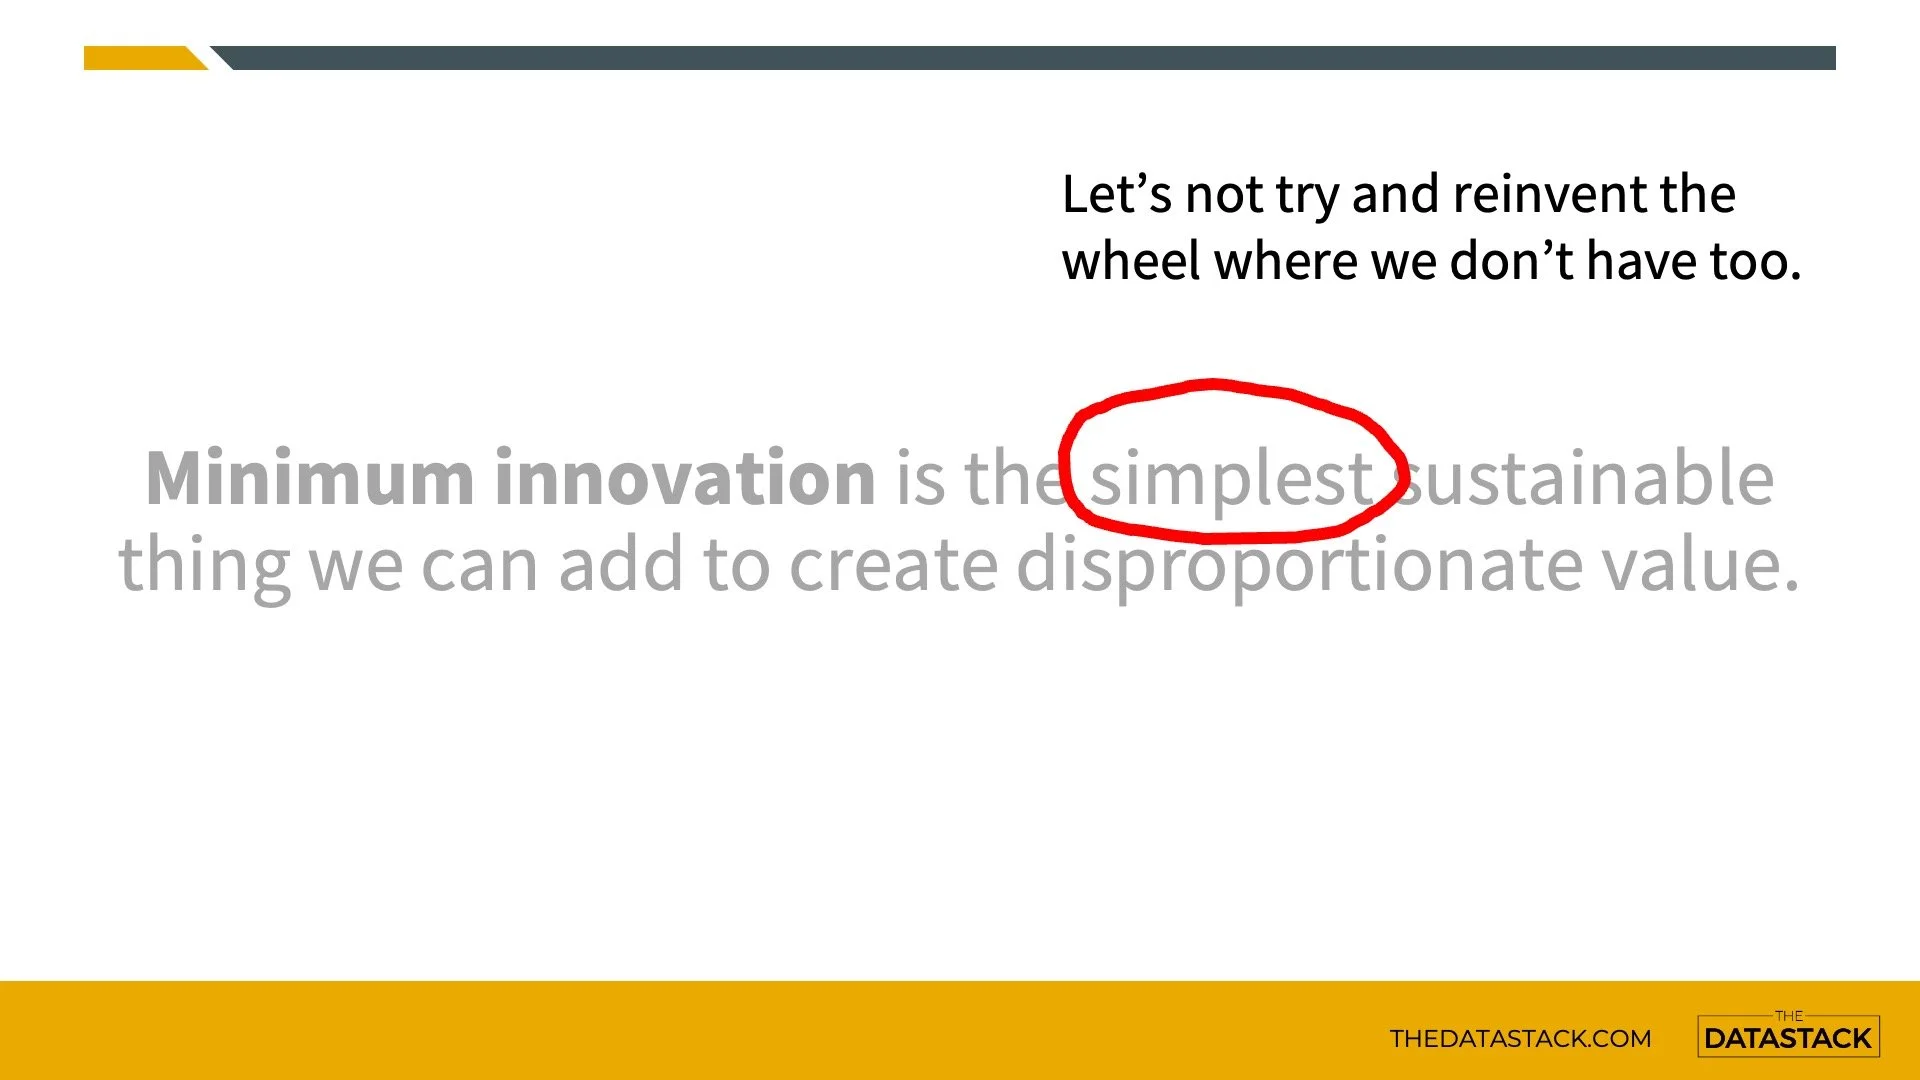
Simplest means let’s not try and reinvent the wheel where we don’t have to.
If existing things work well, let’s try and solve the problem at hand, and connect any new bits to the good stuff we already have in place.
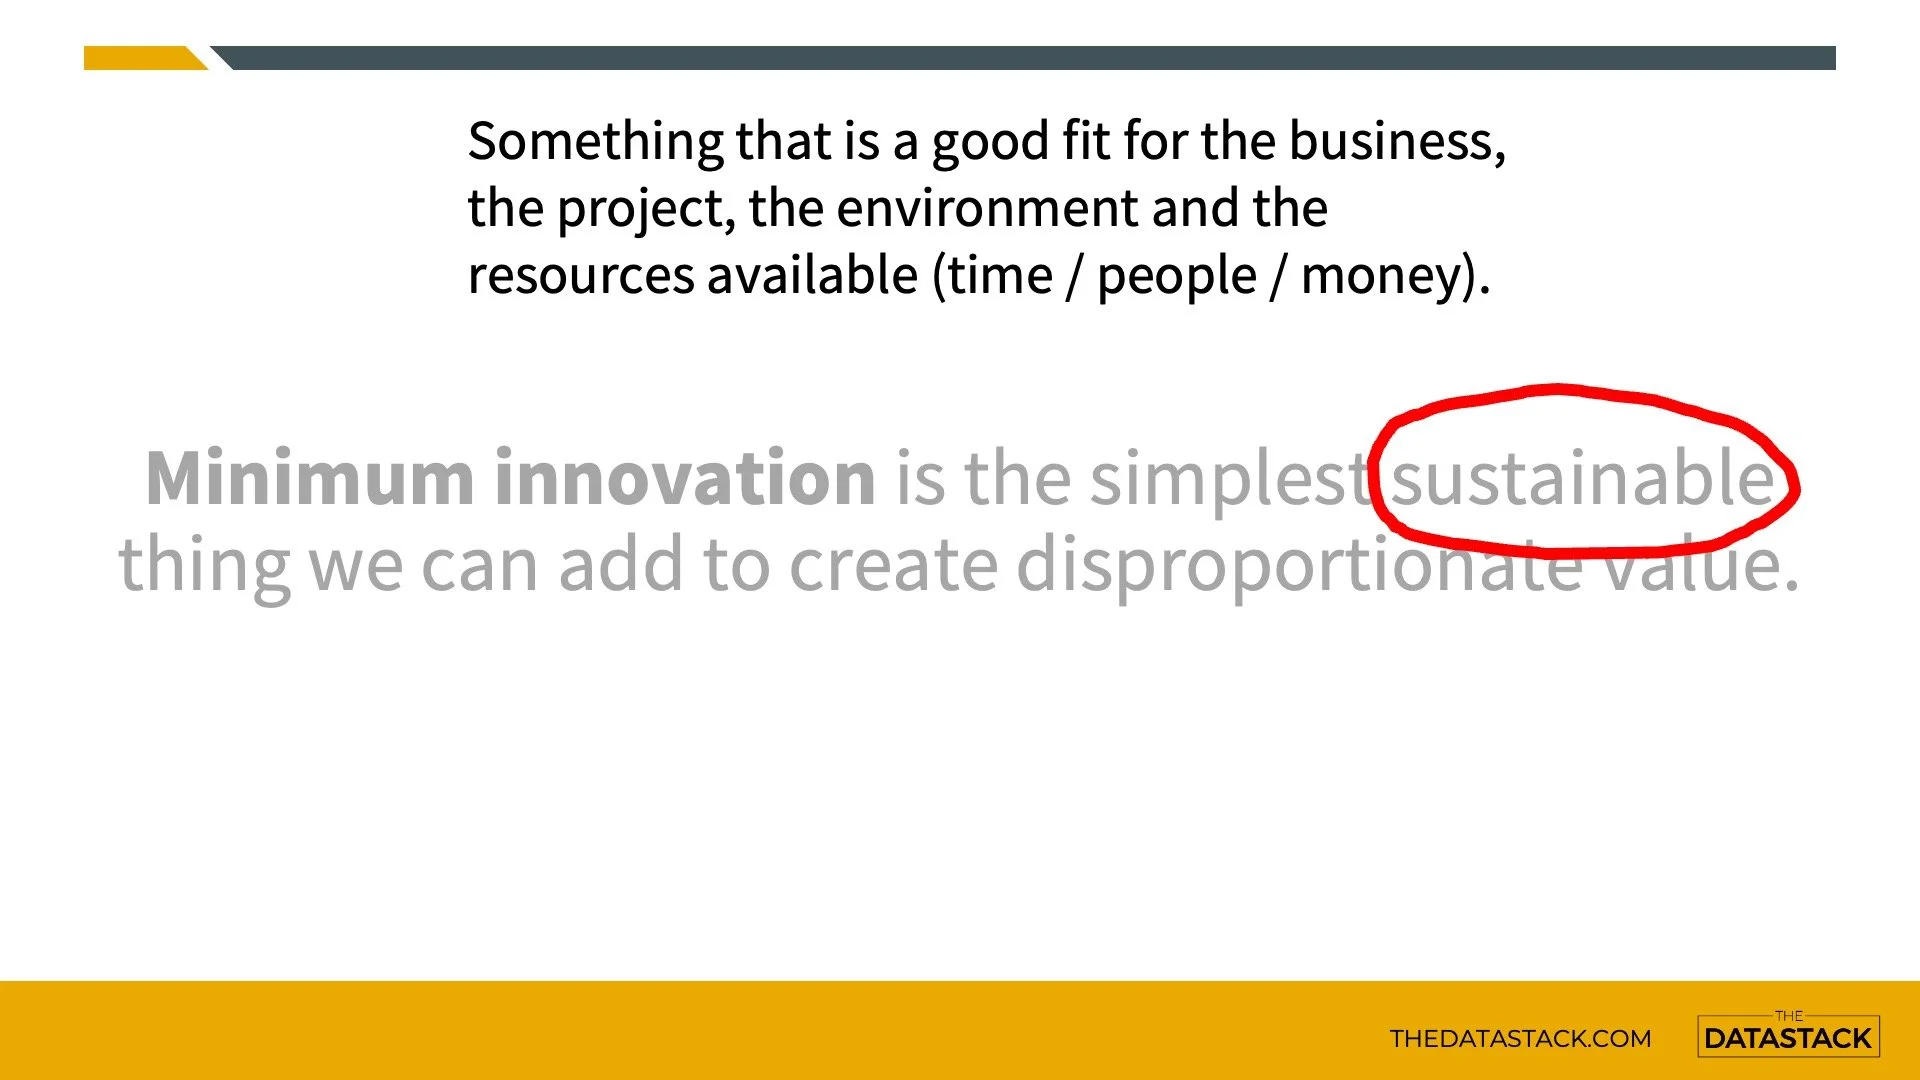
What does sustainable mean?
Any innovative solution we try to build or deploy needs to be a good fit for the business and environment. And it’s something that needs to be pragmatic and affordable relative to our available resources.
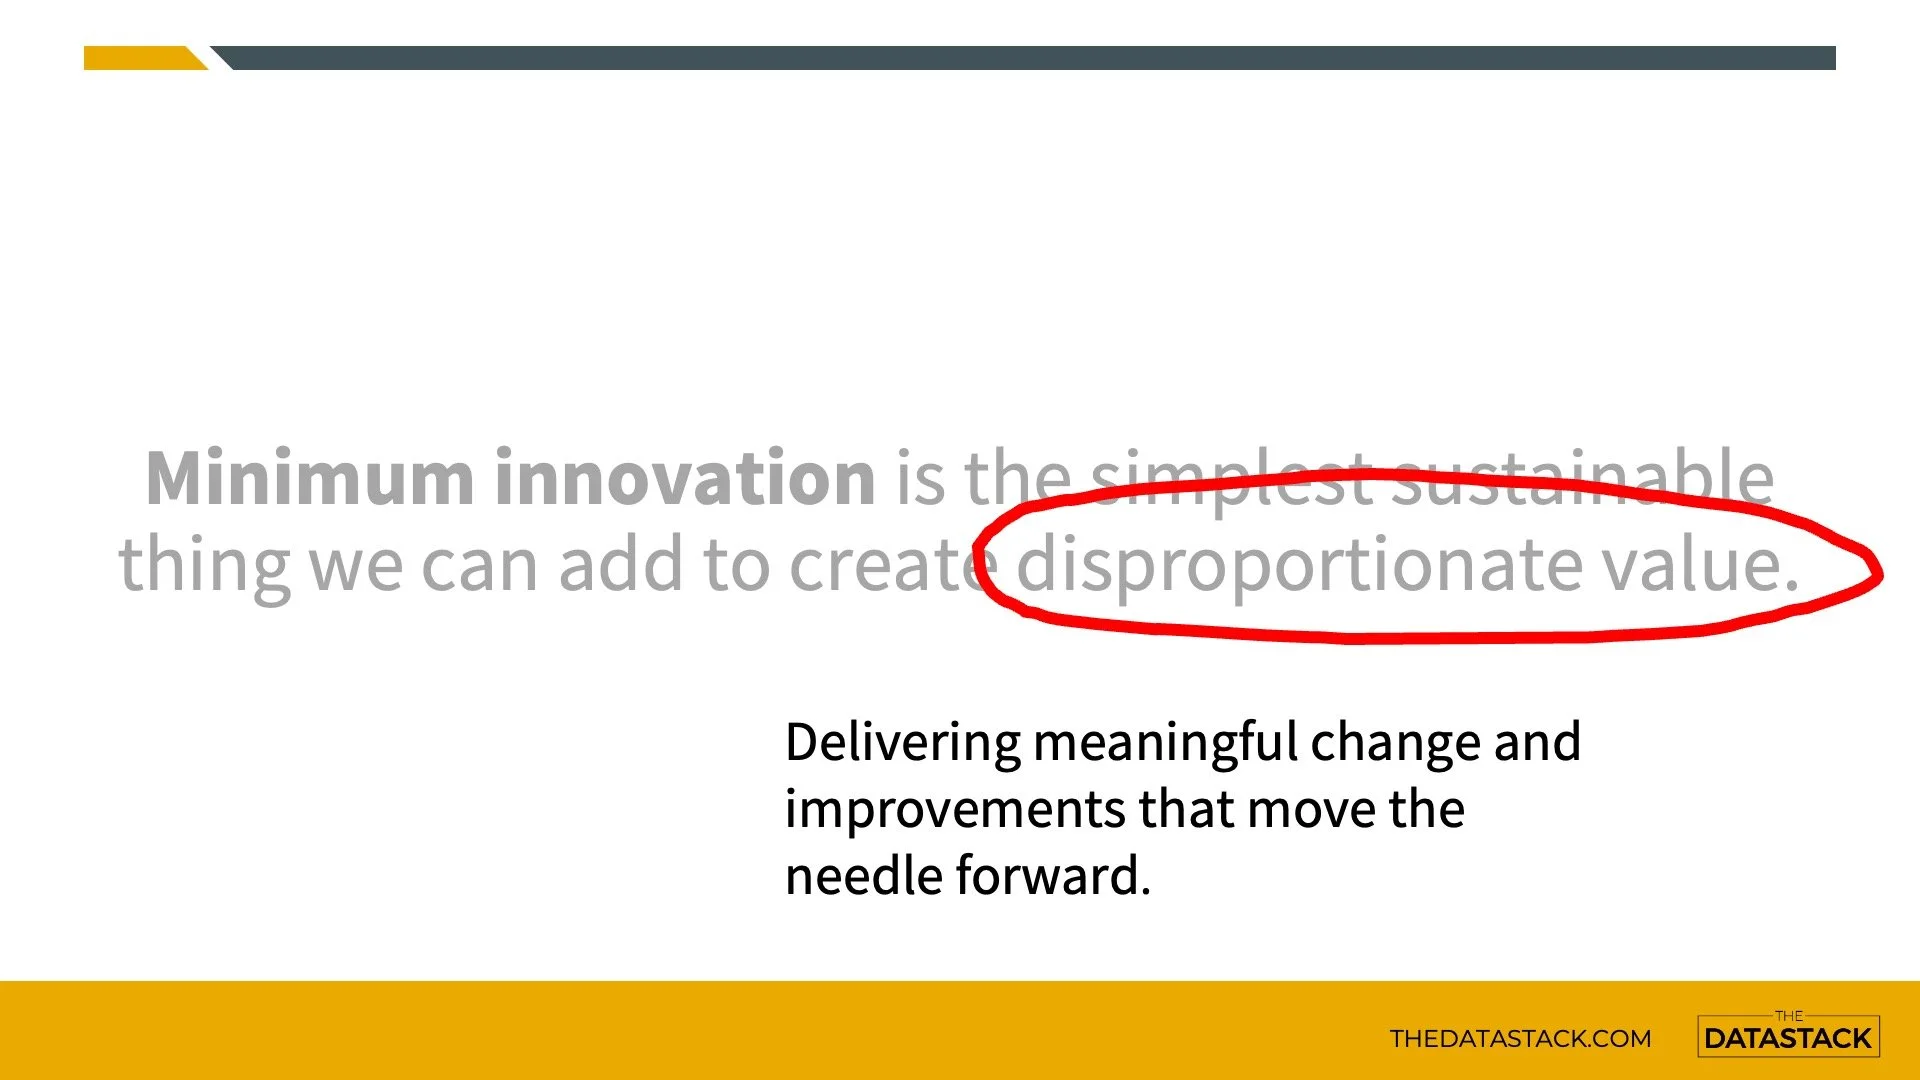
And disproportionate value is all about creating meaningful change.
It’s doing something that will move the needle forward. It’s not adding something simply because we can, it’s adding something because it’s actually going to make a positive difference to what we do.
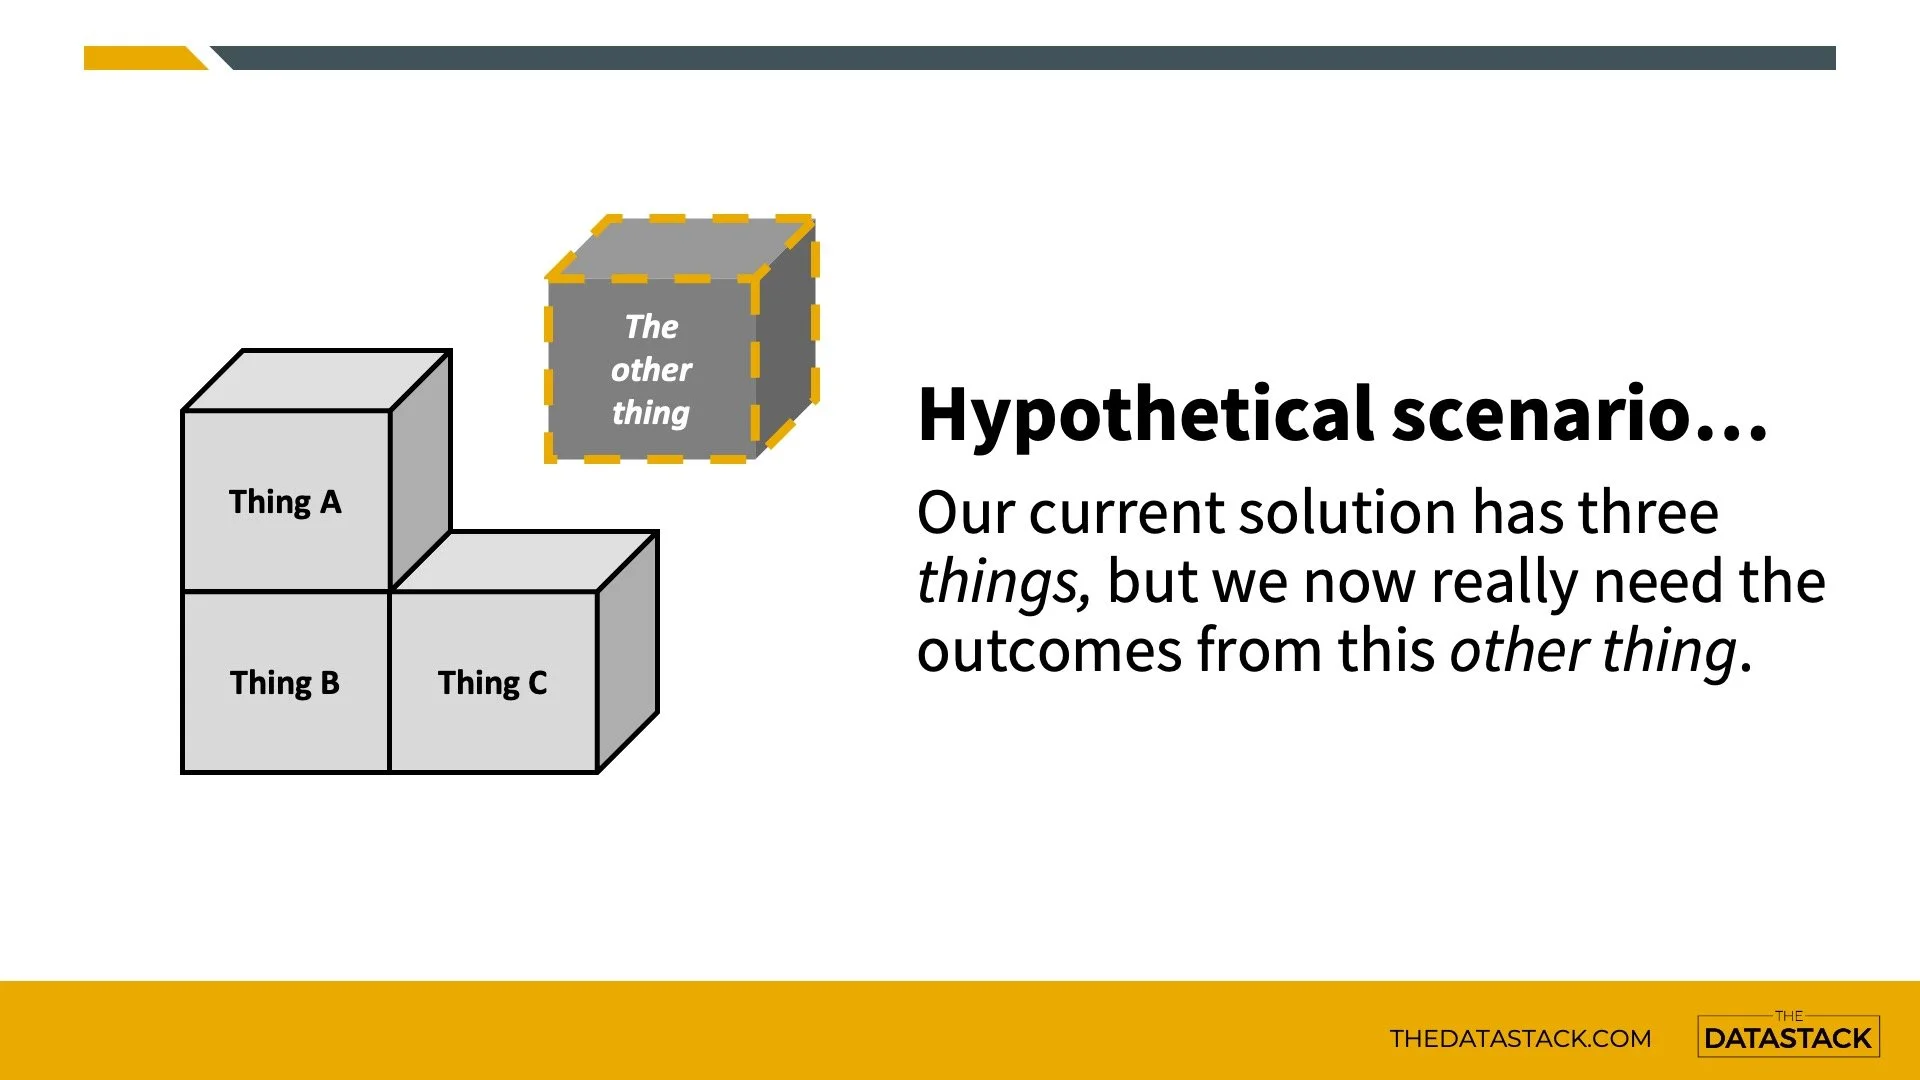
We can illustrate this idea with an incredibly technical and complex visual.
Our current solution has three things – A, B and C. But we now really need the outcomes from this other thing. And we can think of solving this problem in a few ways.
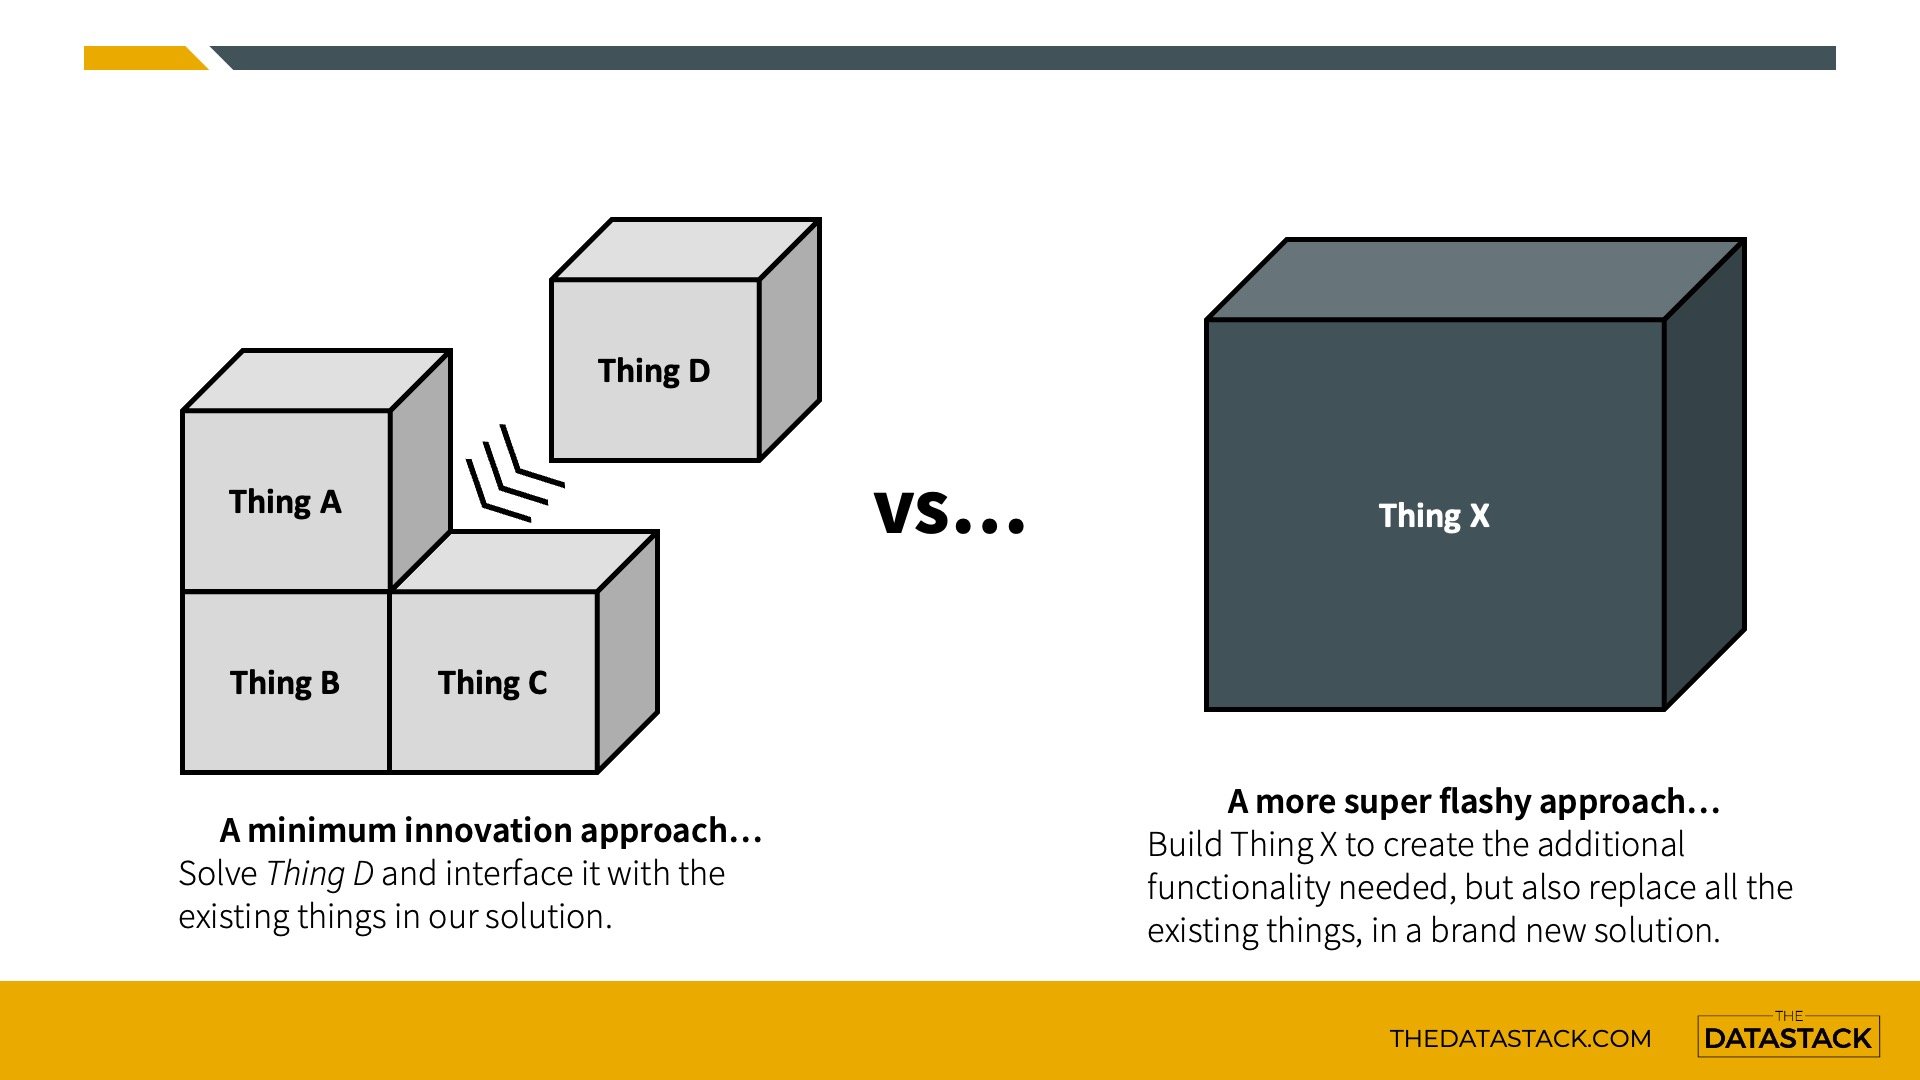
On the left is our minimum innovation approach. Here we solve the problem of Thing D, and connect it in.
On the right is the big bang approach of flashy innovation. Let’s throw out all the old things and build the super flashy new thing x.
And those two approaches can solve the problem at hand, but they will have very different outcomes regarding the operating environment and solution ecosystem. And they also have very different opportunity costs to consider.
Now a minimum innovation approach may not always be the right fit for every project.
And that is perfectly ok.
The critical thing is to define and understand the actual core problem you have, before you even start to look at ways to solve it.
And now for the case studies…

So now it’s time for some case studies to explore minimum innovation in action.
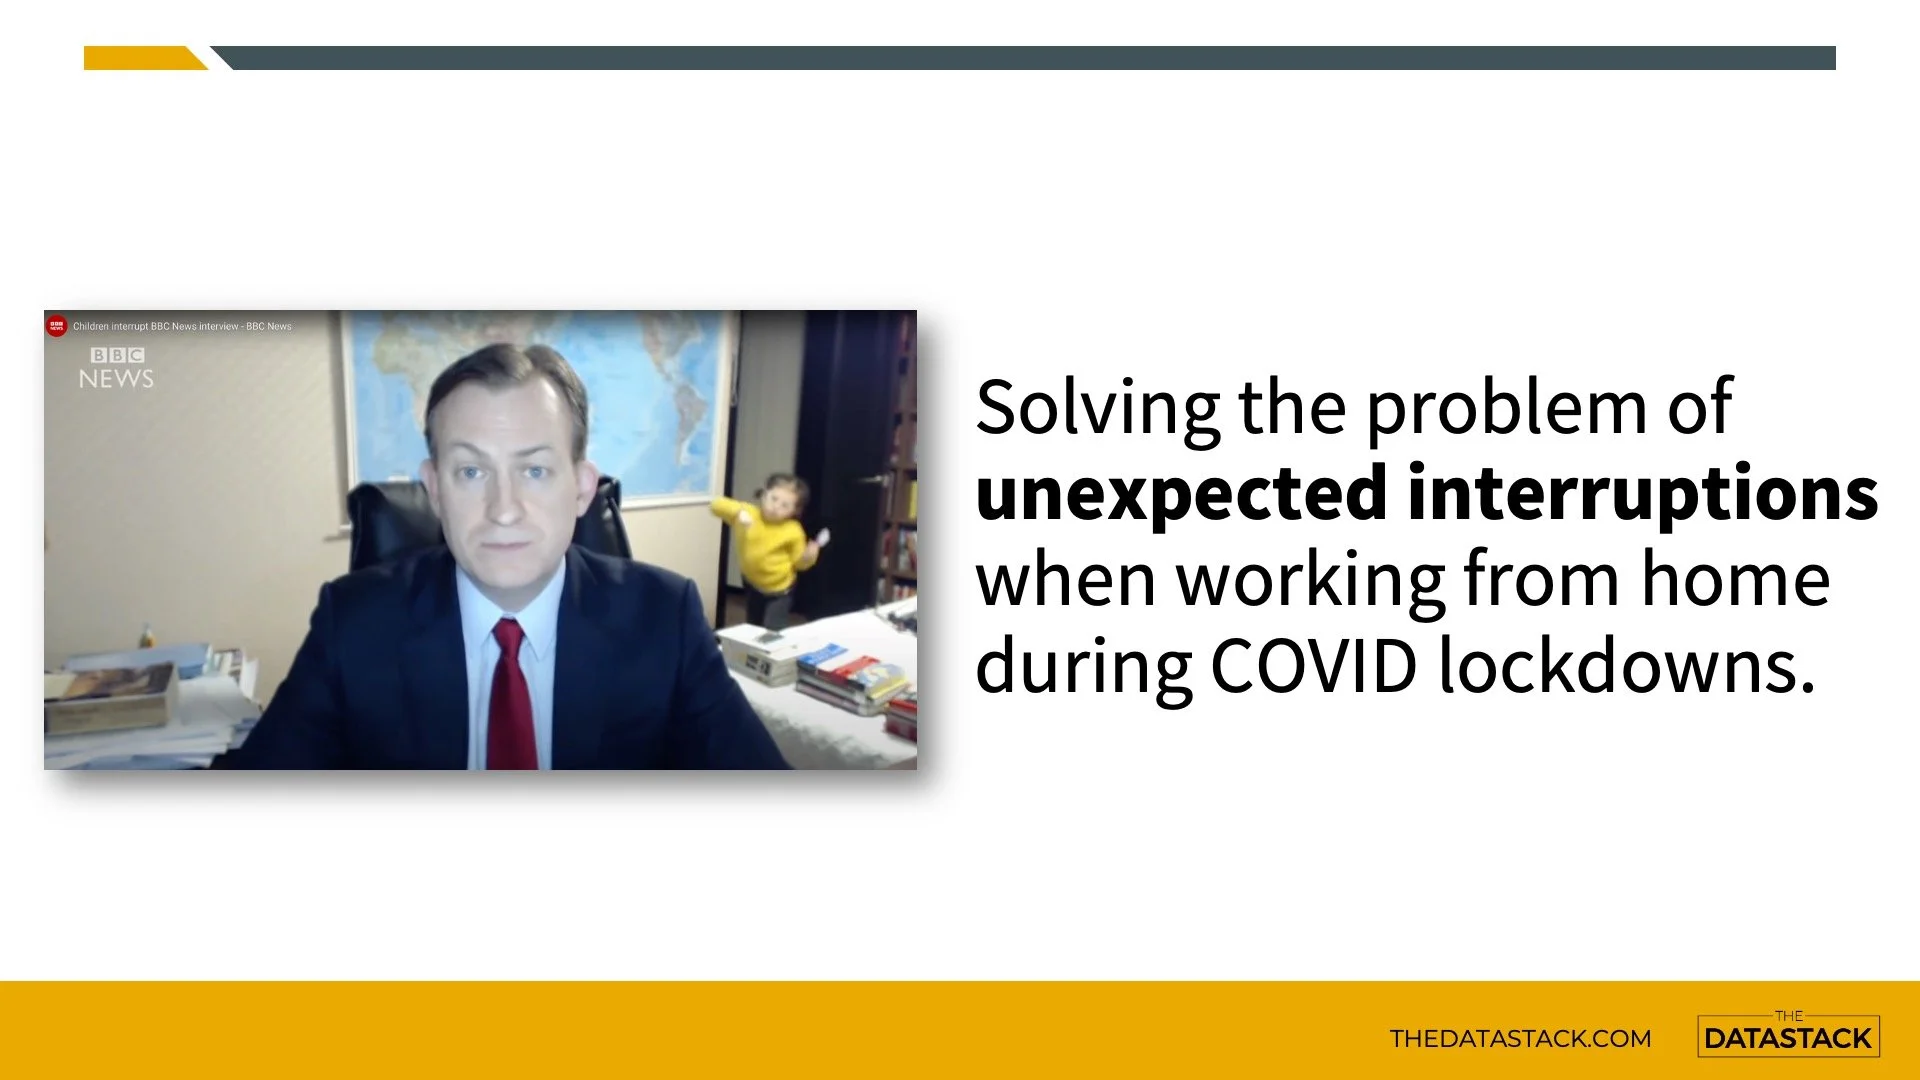
Covid lockdowns changed the way the collective we did our work.
And it also meant that if you had a toddler in the house who usually went to kindy during the week, they were now at home all of the time. And this slight change massively increased the likelihood of unexpected interruptions during work meetings.
This was a challenge that I had, and there was an obvious solution here to solve this problem.
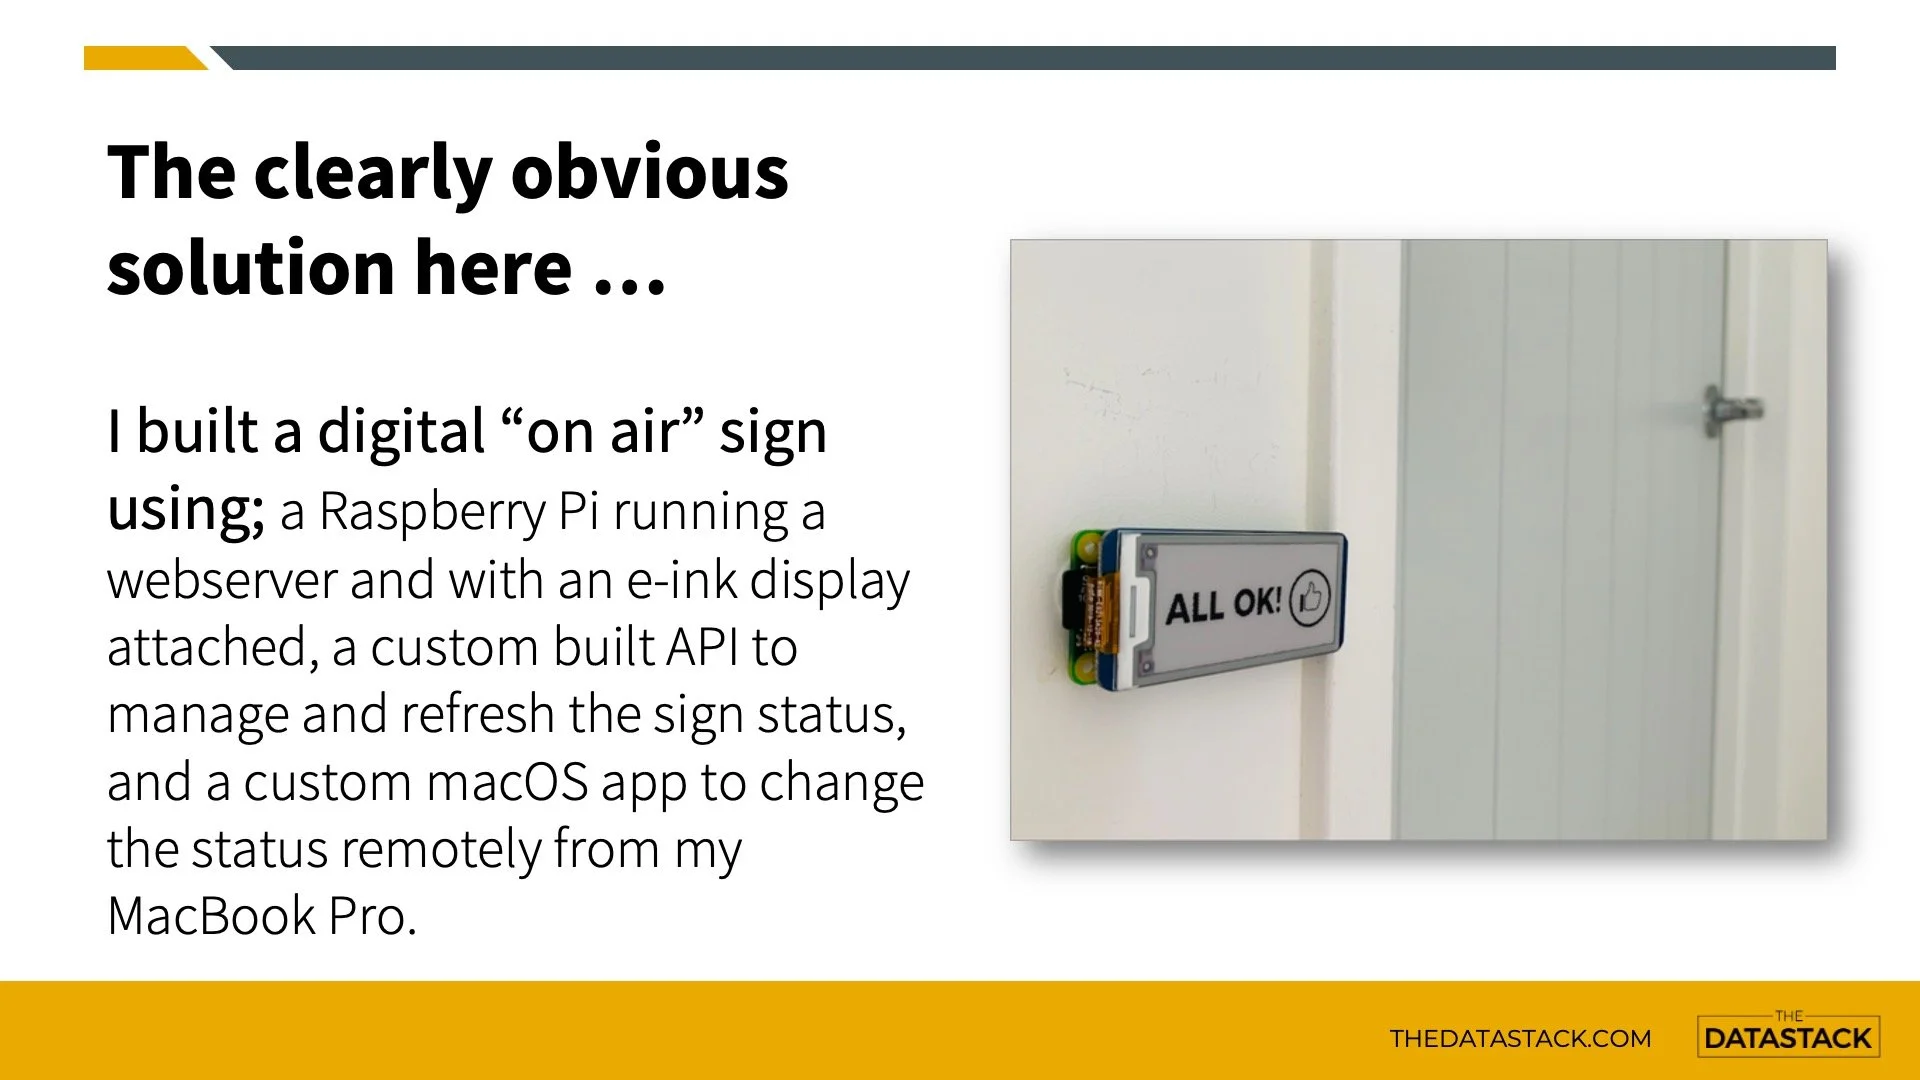
I built a digital on-air sign to tell my toddler when I was in a meeting or if it was ok to come into the office.
On the hardware side, this used a raspberry pi zero which is just a really small form factor computer. There was also an e-ink display attached to the Pi, which is a similar kind of technology as an ebook reader.
I set up a web server and coded an API to sit on the Raspberry Pi to receive instructions to change the sign. And I developed a small macOS app so I could change the status of the sign from my desk.
I am pretty sure this was the most simple, sustainable way to solve this problem.
Do. Not. Disturb.
Ok. So maybe this problem has been solved before with a slightly less flashy approach.
I included this case study because it is a perfect example of non-minimum innovation….
All those soft factors of me being able to geek out a bit, spend some money on new tech toys, and the fun I had building this solution heavily factored into the decision. But given the actual fundamental problem, it was definitely overcooking things at the top end of the flashiness scale.

Ok, so let’s move on to some actual examples of minimum innovation.
The following case studies all feature the RAMM platform from Thinkproject, focussing on the flexibility the system provides its users through features like user-defined tables and SQL code.
These examples demonstrate how using existing data and processes, and doing some smart tweaks around the edges in RAMM, can change the game without needing to introduce overly flashy solutions.
For this first case study, I want to pass on a huge thanks to Darryn who was at MDC at the time. He is a fantastic person to work with and brings so many great ideas to the table.
This was a fault data project for inspection surveys already completed on the Manawatu and Rangitikei networks. Both councils were using the RAMM system to manage their roading assets.
However, the fault data collected did not reside in RAMM, and there was no native table or module to hold the dataset.
So this project made a series of micro improvements, by leveraging this existing survey information and RAMM, to change the game for this data. And the solution was rolled out to both councils.
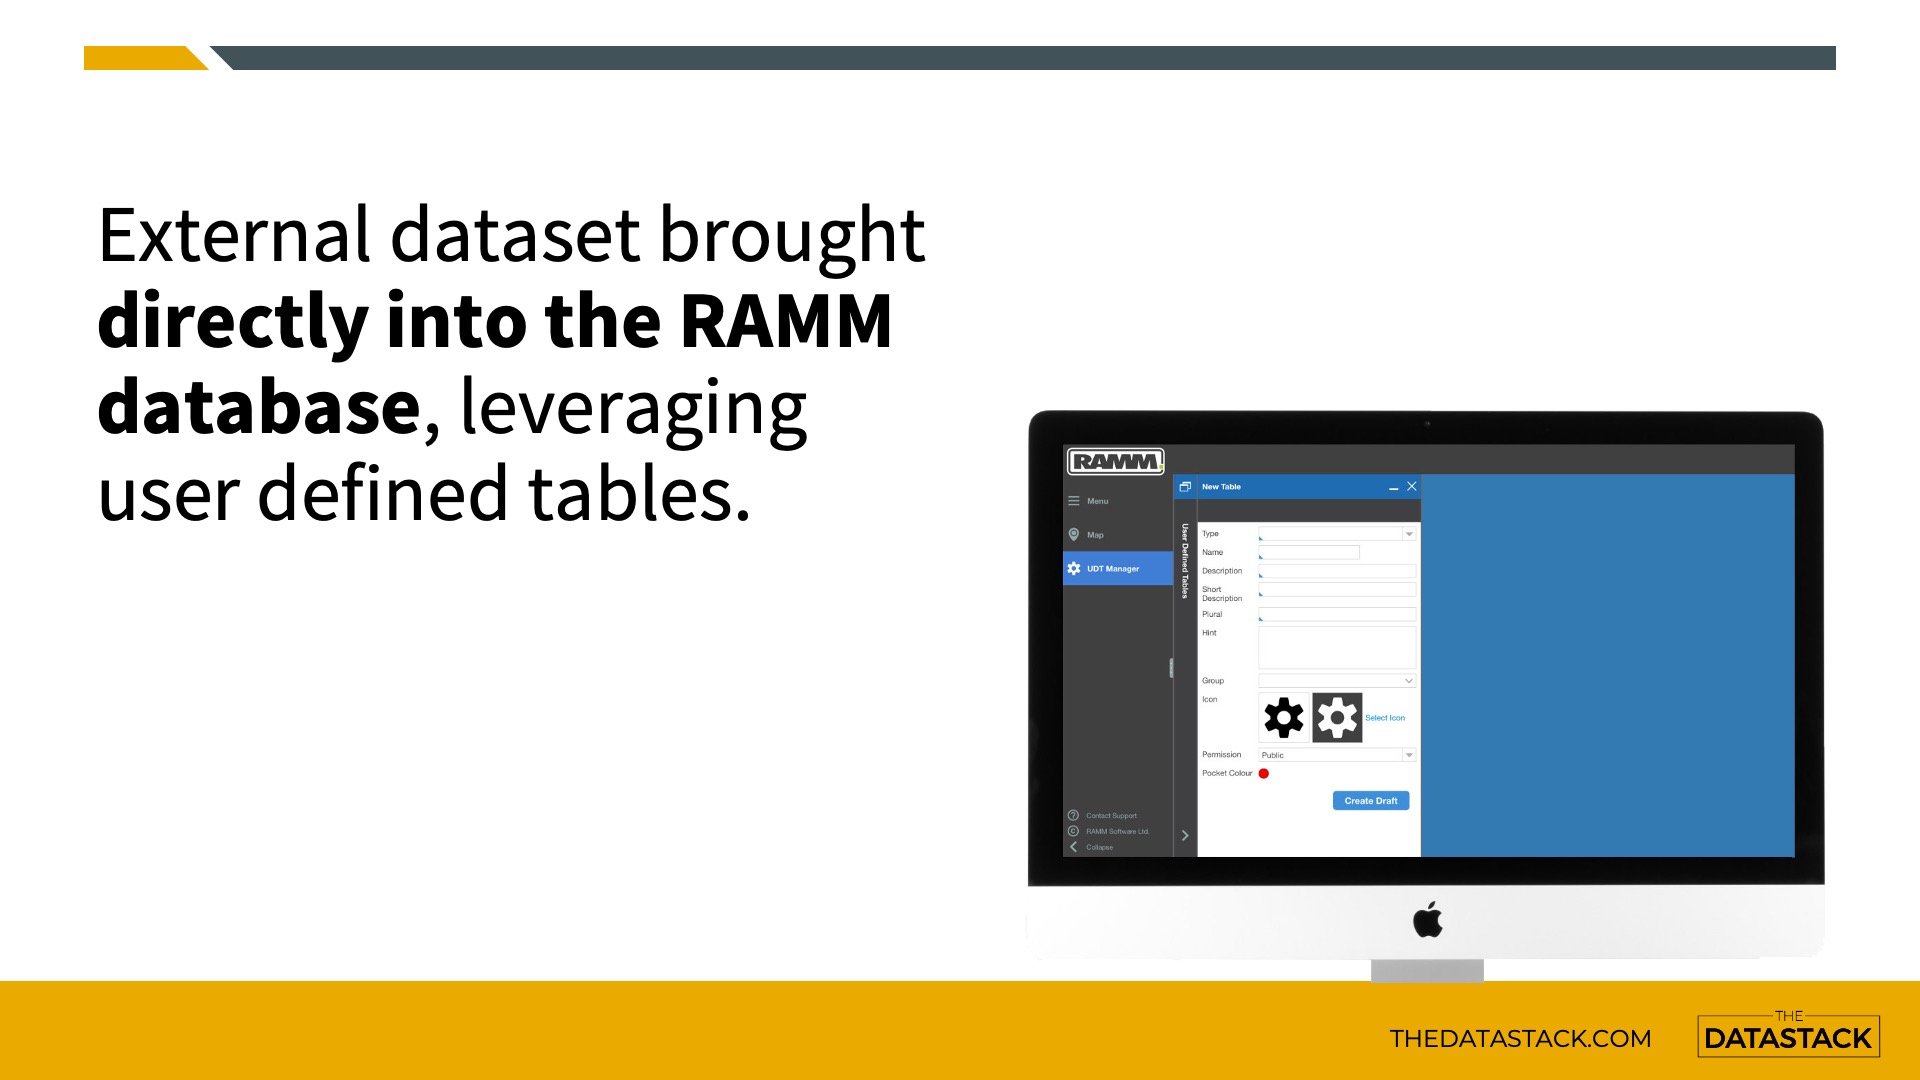
The first significant outcome was bringing the dataset into the RAMM environment, so the data lived in the same space as where everything else was happening for the network.
The data was migrated to a user defined table, or UDT, to model and capture the key attribution from the inspection survey. And it also leveraged core elements from RAMM, like location, dimension details, and survey headers.
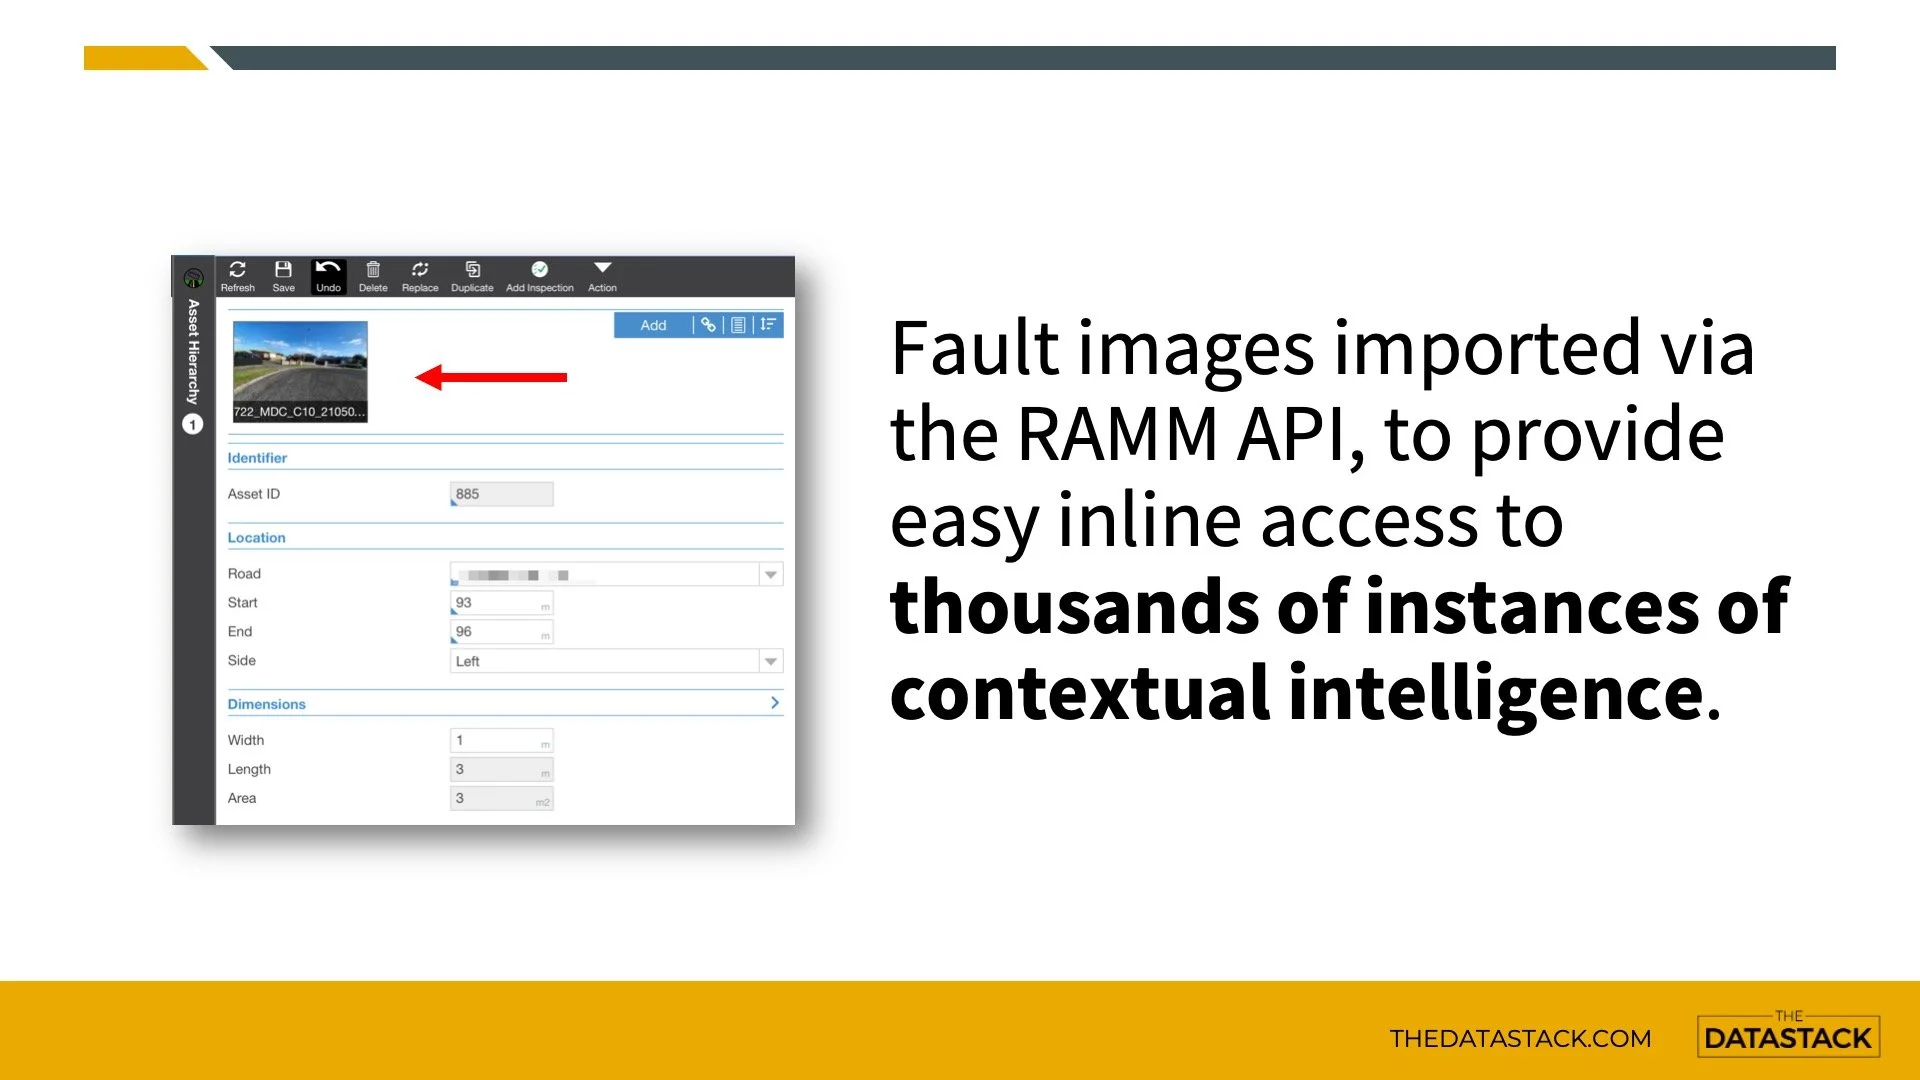
During the field survey, the inspectors took a photo of each individual fault that was recorded.
So I used the RAMM API to seamlessly bulk import all these images into the RAMM database, attaching them to the relevant faults in the UDT dataset.
This simple win brought literally thousands of pieces of visual intelligence into RAMM, from information already procured and collected.
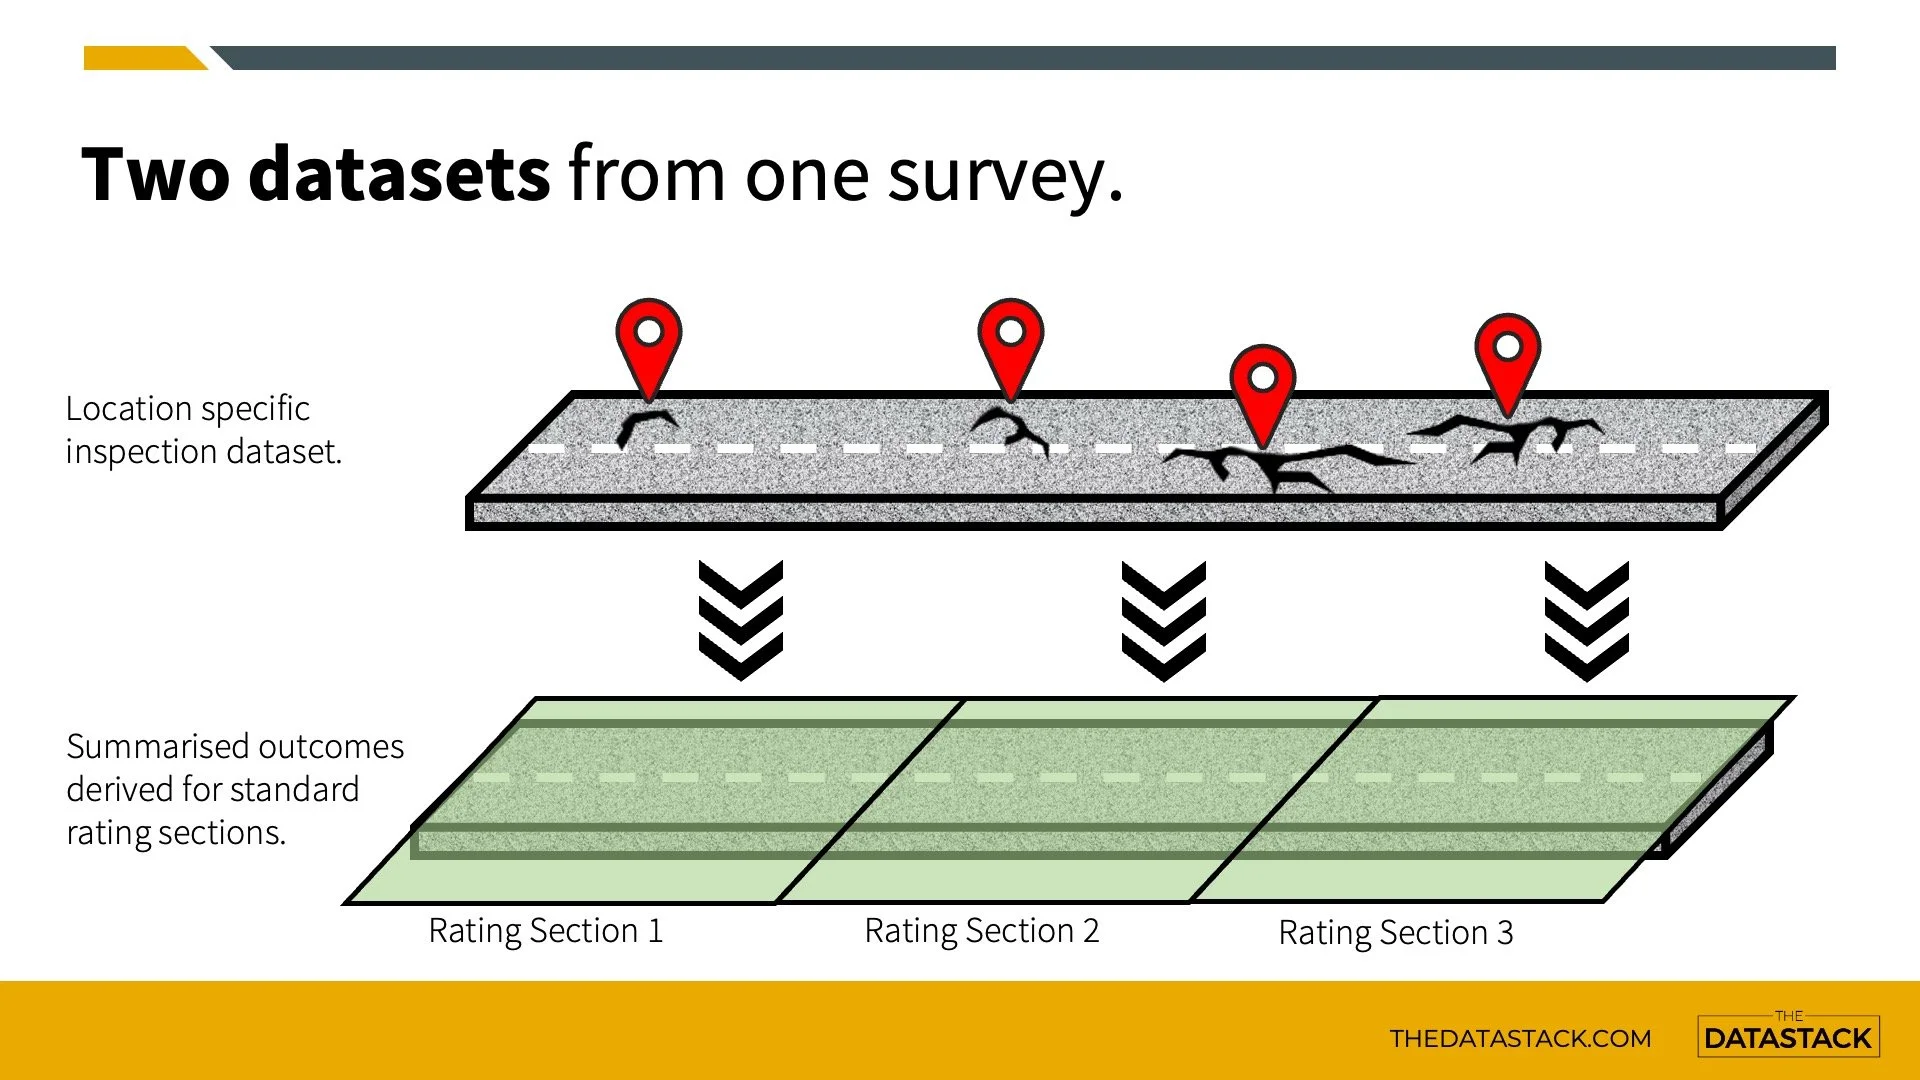
Each fault collected in the dataset was individually located within the context of the network.
However, RAMM also has native rating section functionality, representing aggregated fault data for linear road sections.
The data was aggregated and summarised using the individually located fault records to those standard RAMM rating sections via a SQL script. Those standard rating sections were then available with updated inspection results everywhere they were used.
Another simple win, generating more value from existing data.
How do you know if an identified fault is still relevant today or has been repaired after the survey was undertaken?
Some clever use of dispatches can help provide some simple insights into this space.
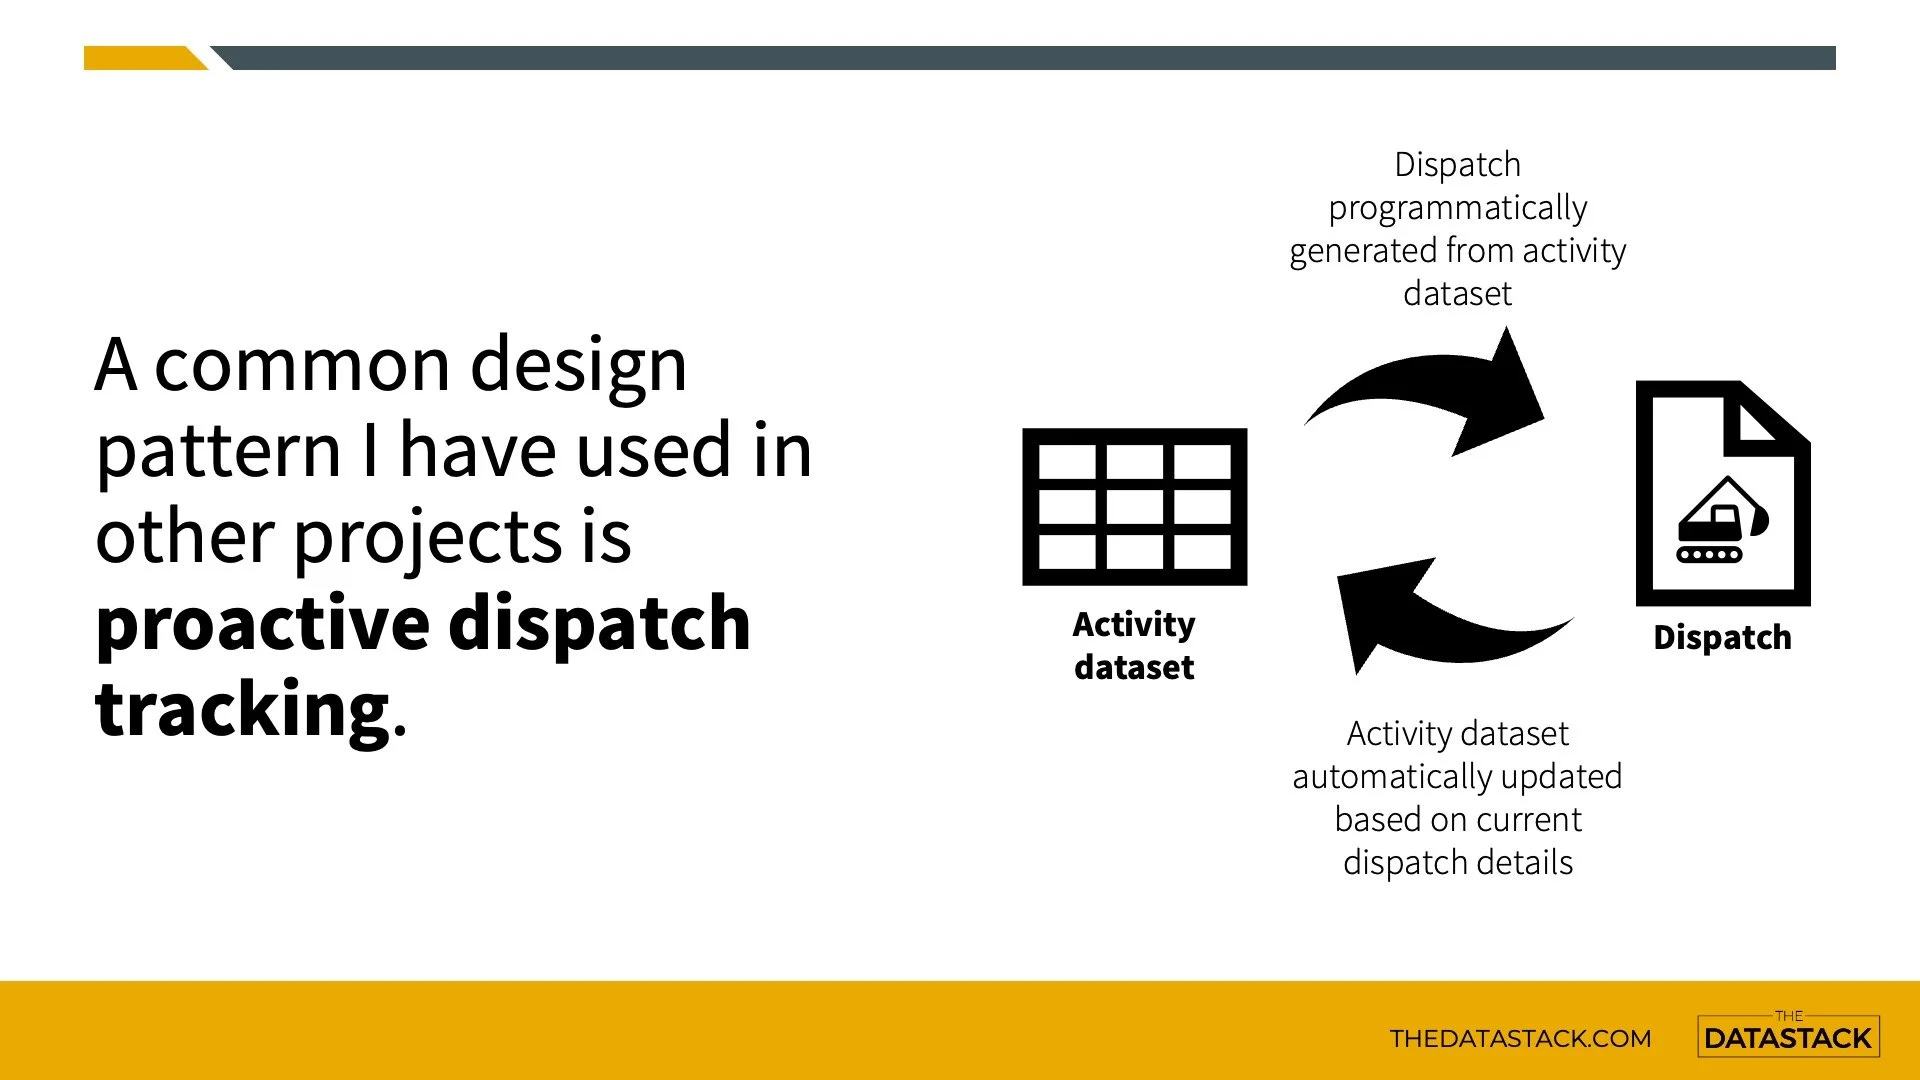
RAMM uses the concept of dispatches to define and manage jobs that need to be done on an asset, like filling a pothole or repairing a crack.
A common design pattern I have used in other projects is this idea of proactive dispatch tracking. This is where dispatches are programmatically generated off a dataset, with those dispatches then actively monitored and tracked over time.
However, one purpose for this project's fault dataset was to be an input into the existing maintenance and renewal programming workflows, rather than becoming a programme of activity on its own.
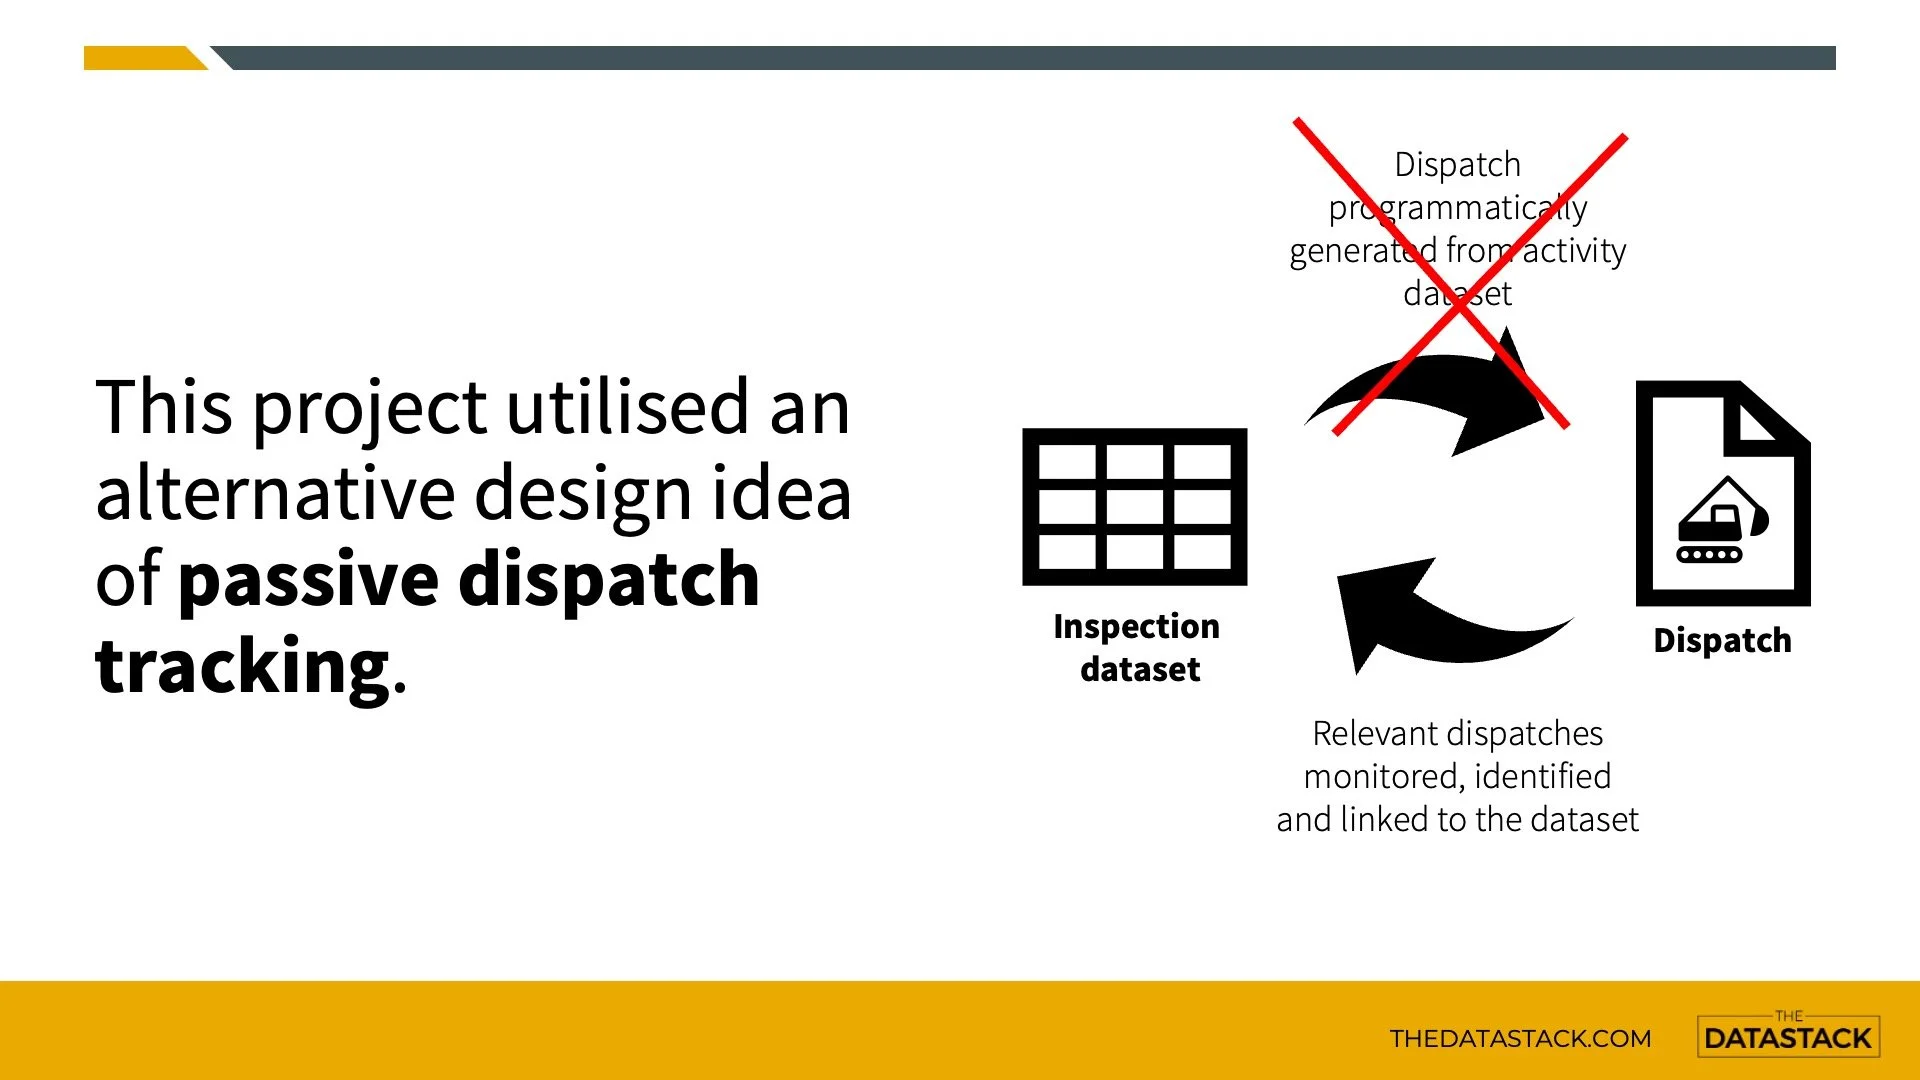
So for this project, we took an alternative approach, adopting the idea of passive dispatch tracking.
This meant that no dispatches were directly generated from the inspection records. But the day-to-day pool of dispatches on the network is actively monitored, to create links to relevant fault records based on criteria like location and the type of work being done.
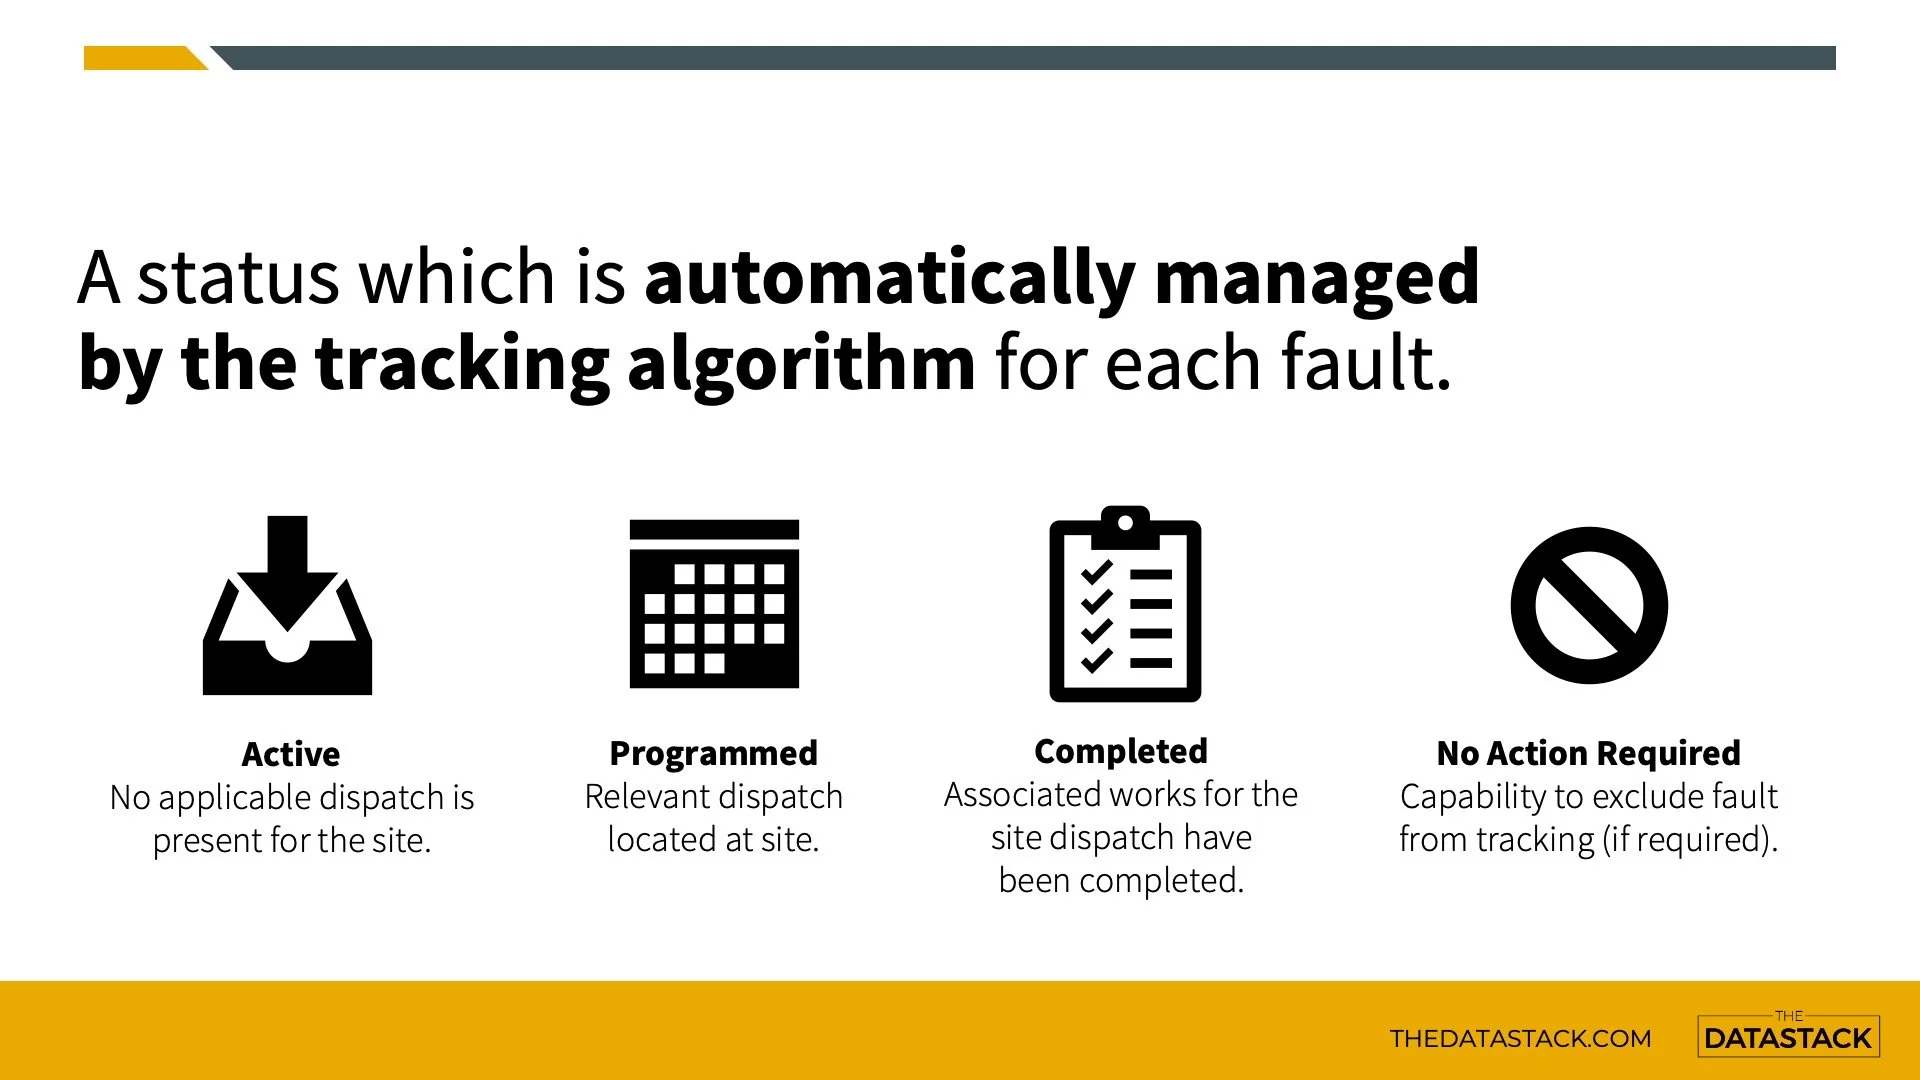
This passive dispatch tracking and linking means every fault record has a status, to give a simple view of what its current state is based on maintenance and renewals activities that are taking place.
So if a pothole is filled on the road via a dispatch, the status of the fault in the fault dataset is updated to show it has been completed.
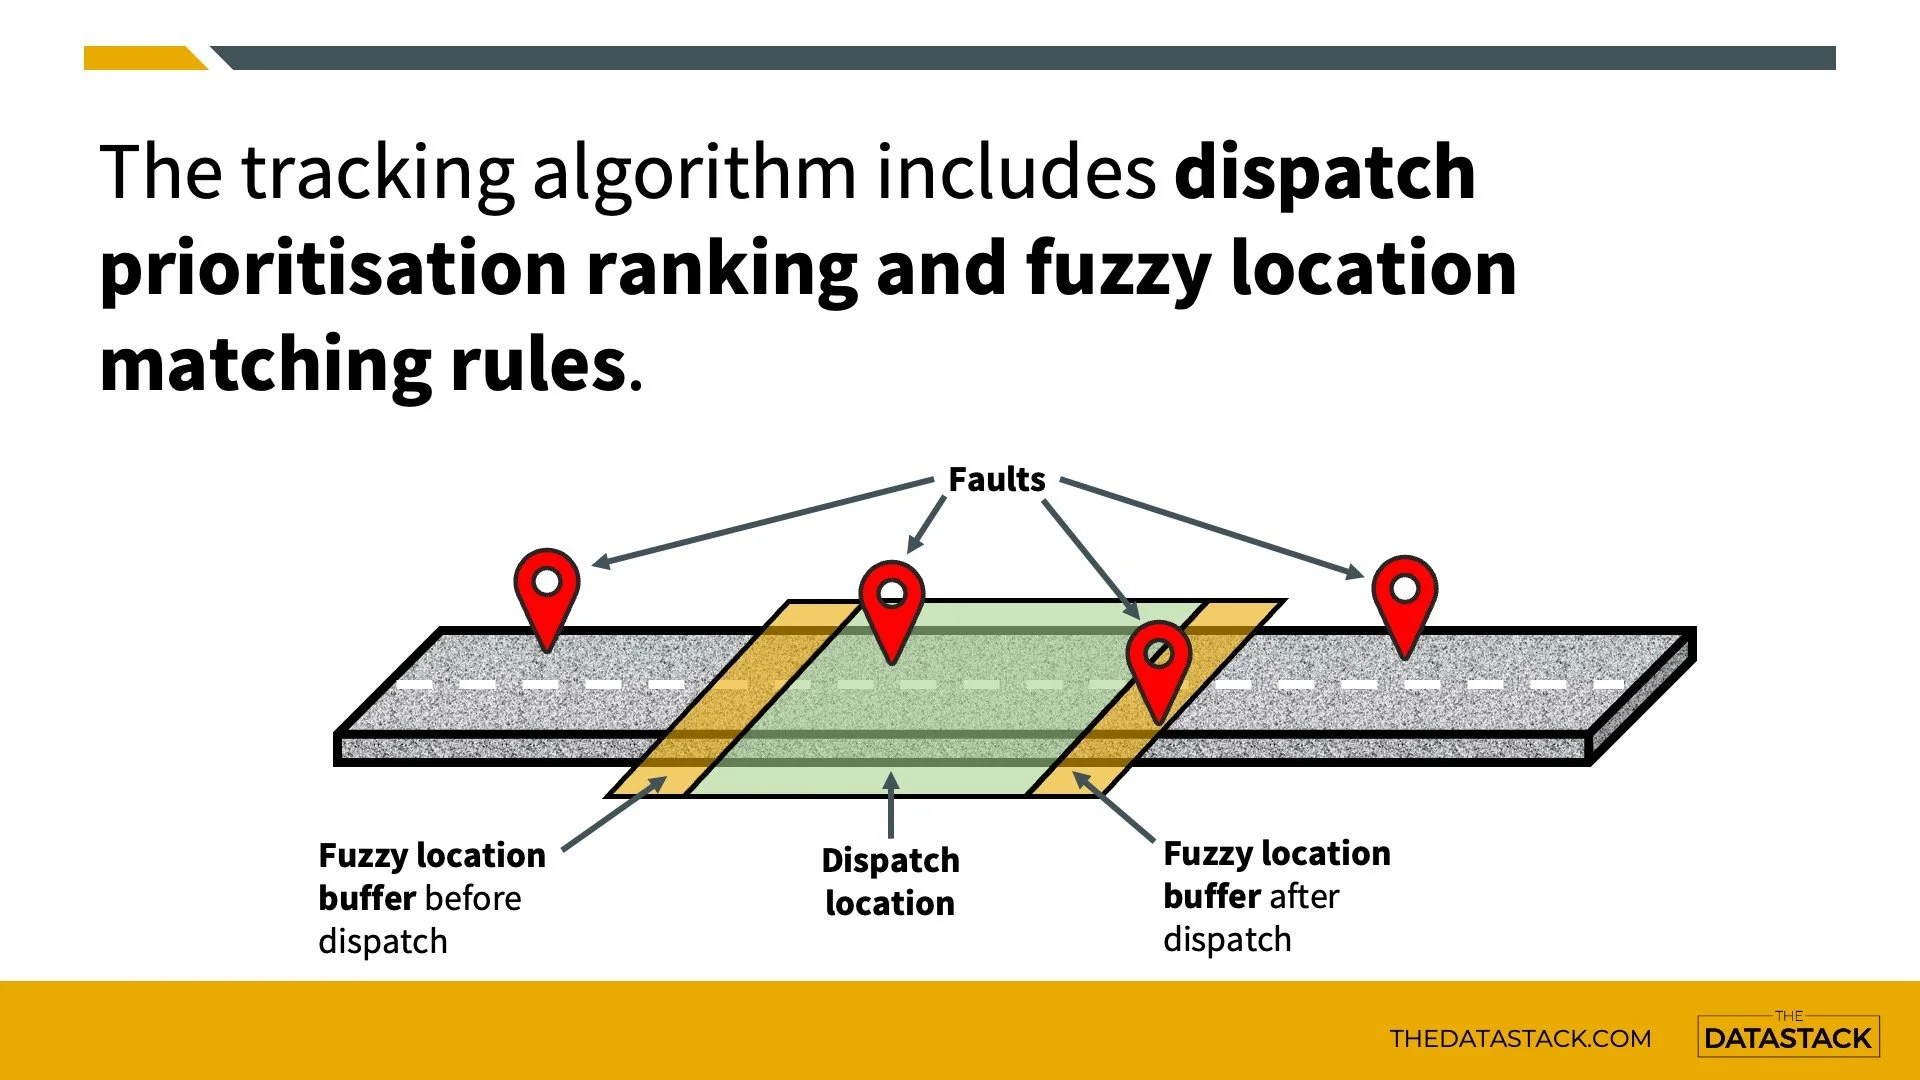
An algorithm runs every night to monitor the dispatches, prioritise them, and make these status updates.
If multiple candidate dispatches exist for a given fault, this process picks the best one to be linked.
The algorithm also applies fuzzy location rules to allow flexibility in the location-matching criteria. This allows things like a relevant dispatch, that is say 1m away from a relevant fault, to be still considered a potential match. And if the outcomes need some tweaking, these fuzzy location thresholds can be changed and the linking process rerun, in a way that is non-destructive for both faults and dispatches.
So this status tracking builds on top of the robust day-to-day dispatch and programme management workflows already happening on the network.
And the linking and status management updates all happen silently in the background, without introducing any friction to these existing processes.

Now onto case study 3 which is all about unsealed road activities.
Before we dive into the details, I first want to pass on a massive thanks to the Auckland Transport team of Alison, Allie and Amanda. I really enjoy working with this amazing team, so a big thank you to them.
The origin of this project was the idea to supercharge the management of activities on the unsealed road network.
The dataset for managing these activities was initially prototyped in a spreadsheet. As Auckland Transport uses the RAMM system to manage its roading assets, this presented some added-value opportunities to do things there.
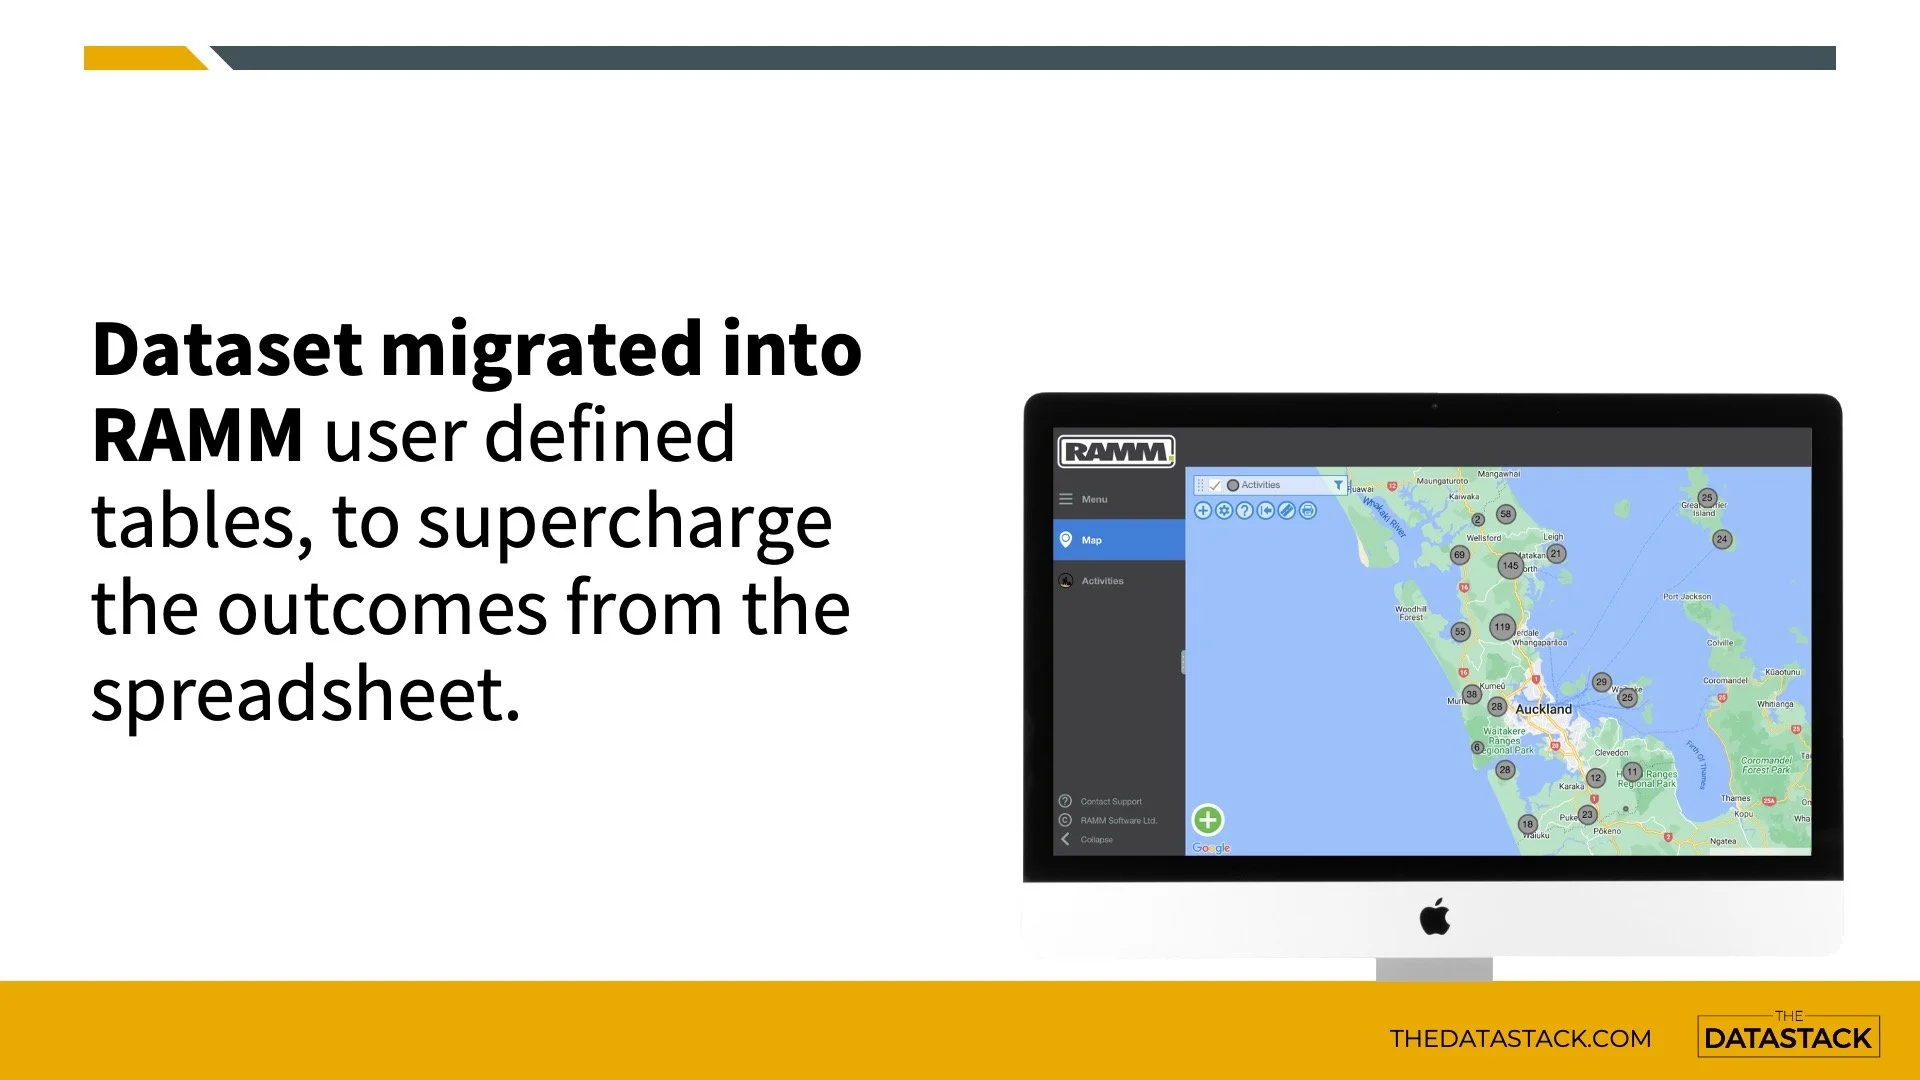
The first step was to bring this data into the RAMM environment. With no native table or module to hold this bespoke dataset, the data migration was achieved by designing some RAMM user defined tables.
These tables modelled all the required attribution to define each activity in the programme.
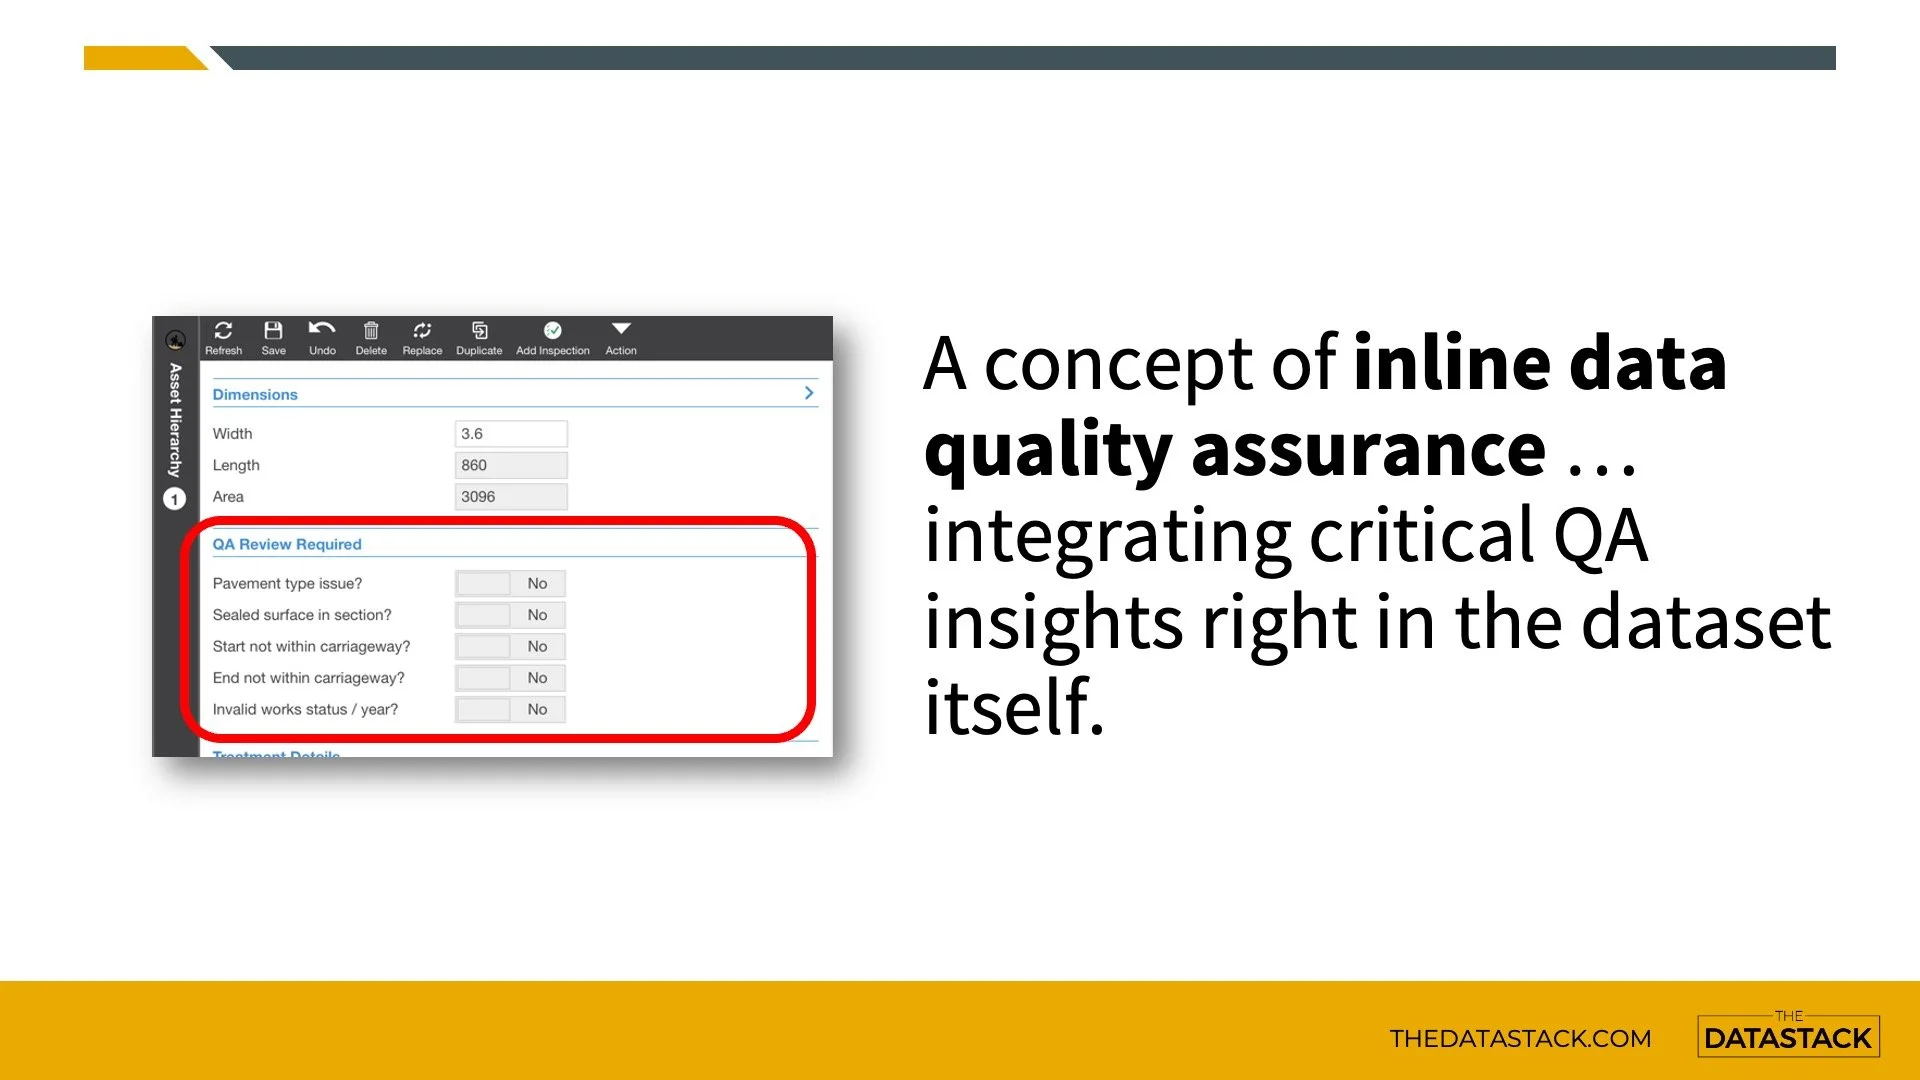
This really cool idea of inline data quality assurance was incorporated into the design of the UDT.
A few critical data QA metrics needed to be monitored, so these were placed right at the coal face – embedded into the dataset itself. And these QA tests are automatically run and refreshed every single night.
So now, the user doesn’t have to run a script, check a report, or access another QA solution. That information is available and ready right at their fingertips.
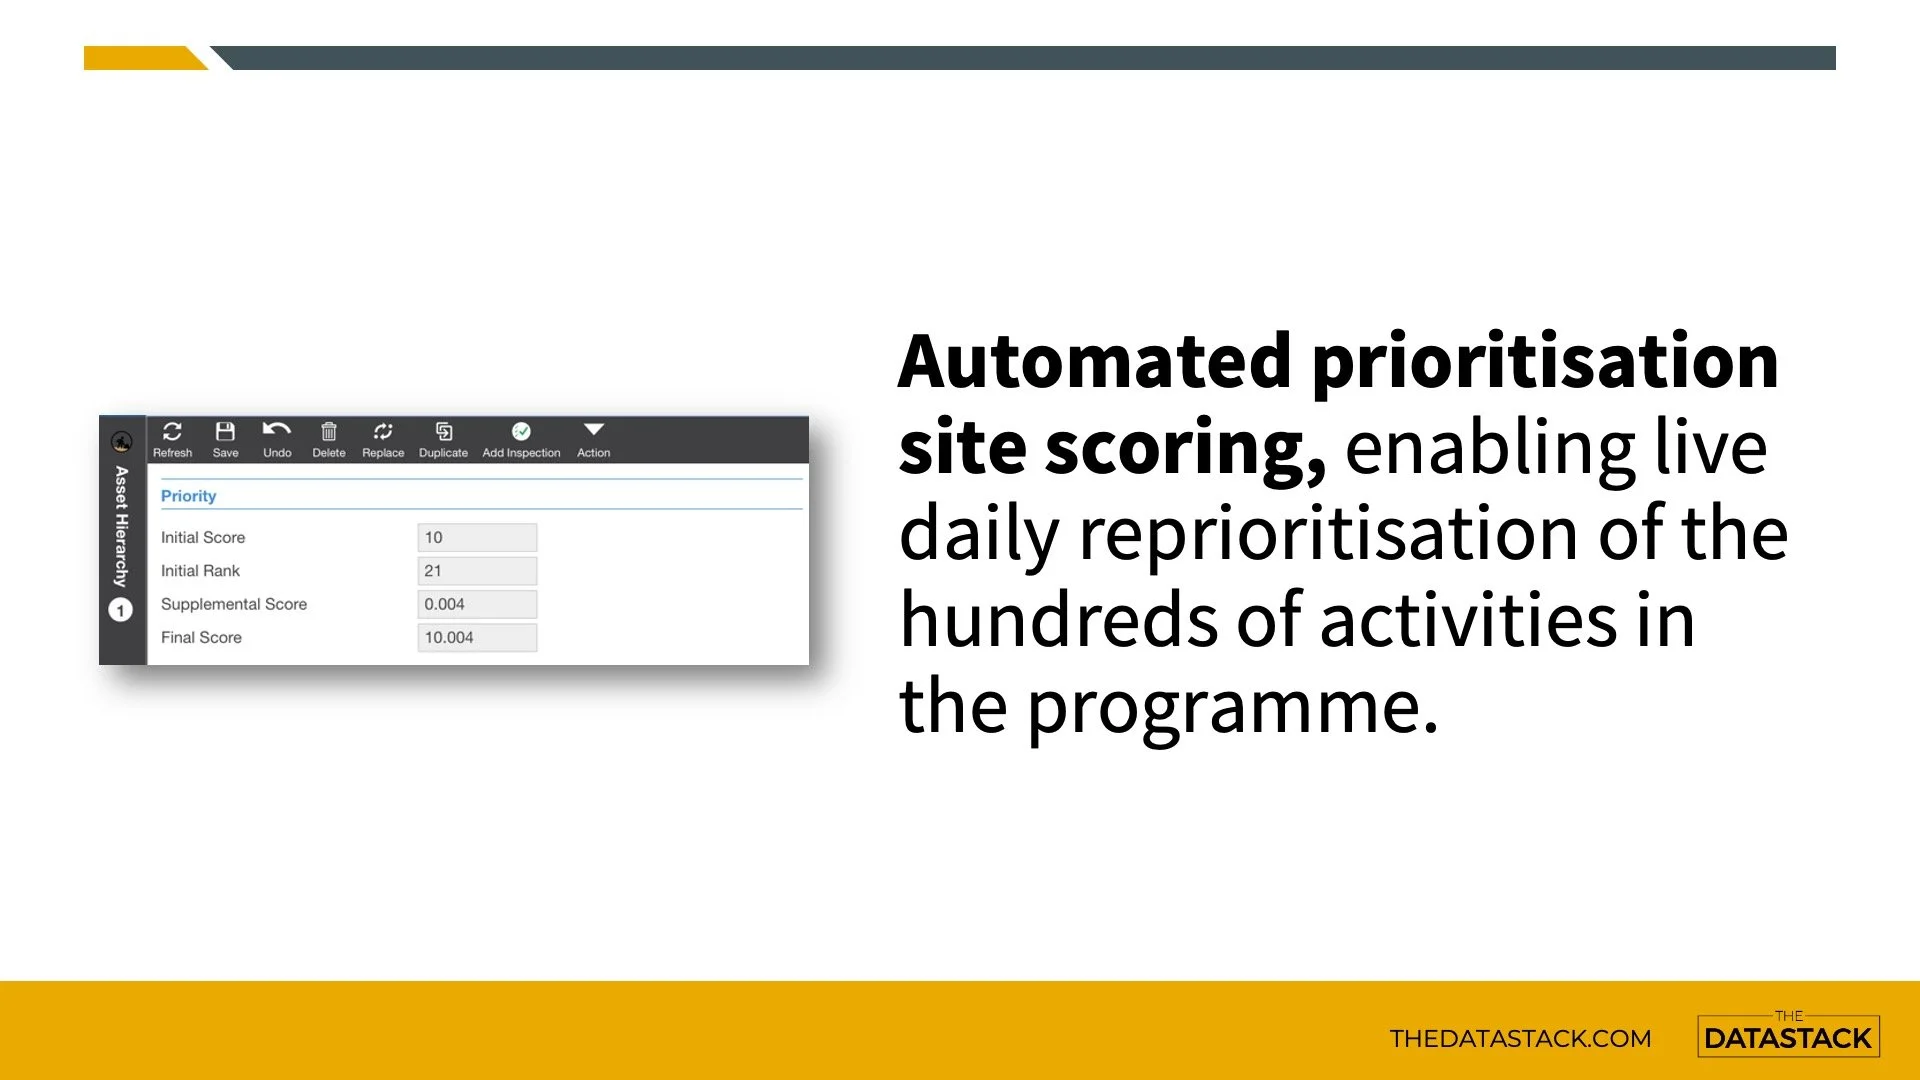
One of the key outcomes in the original spreadsheet was activity prioritisation. In this process, a ranked score was given to every site based on a series of different input factors.
In the new RAMM setup, that same prioritisation method has been recreated to rank every activity via an algorithm, in the form of a SQL script. And the algorithm has been set up to run automatically every single day.
This means the site ranking is based on the latest up-to-date network and performance data available in the RAMM database during prioritisation.
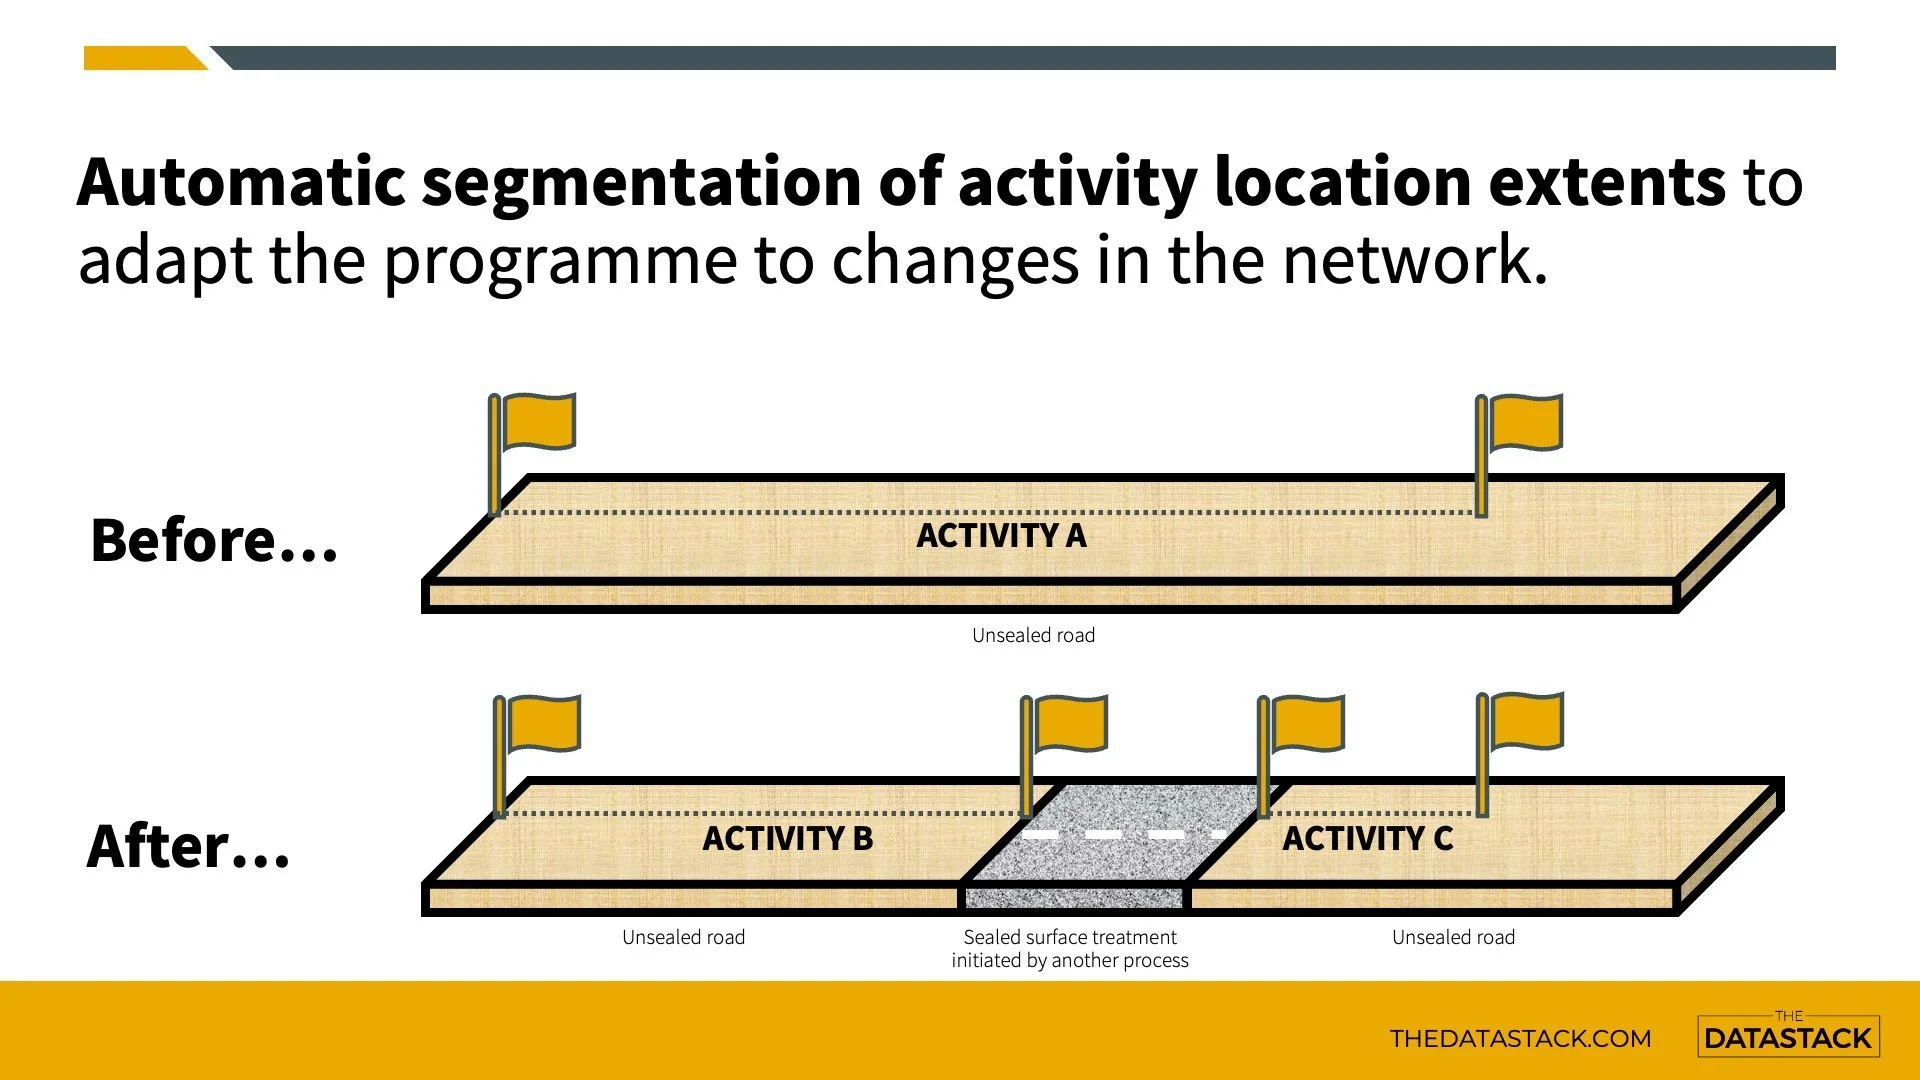
From an operational perspective, many things are happening on the network through different activity channels. Perhaps an unsealed corner has now been sealed through an expedited safety project, and the location was in the middle of a future sealed road extension site. That type of information can naturally take some time to flow into all the places and datasets where it needs to be recognised.
What's really cool about this solution is that the unsealed activity locations are automatically re-segmented, if a sealed surface section is added to the database. This avoids the need for manual reconciliation with surfacing data at the end of the year, or retroactively identifying that changes have been made.
And when this re-segmentation happens, the relevant activity details like cost estimates and site prioritisation are all automatically recalculated.

And now the final case study which shows some neat outcomes achieved from recreating a workflow in RAMM.
This project was delivered in collaboration with a Contractor client, and was all about managing the capture and reporting of certain events on the roading network.
When one of these events occurred on the network, reporting outcomes needed to be produced, and sometimes further follow-up actions were required on-site.
The data being captured by the team was evaluated, and the specific attributes were created within a RAMM user defined table. This allowed all current data items to be captured directly in the RAMM environment. The opportunity was also taken to add new helpful attributes not currently captured and leverage RAMM lookup tables for things like network identifiers and staff codes.
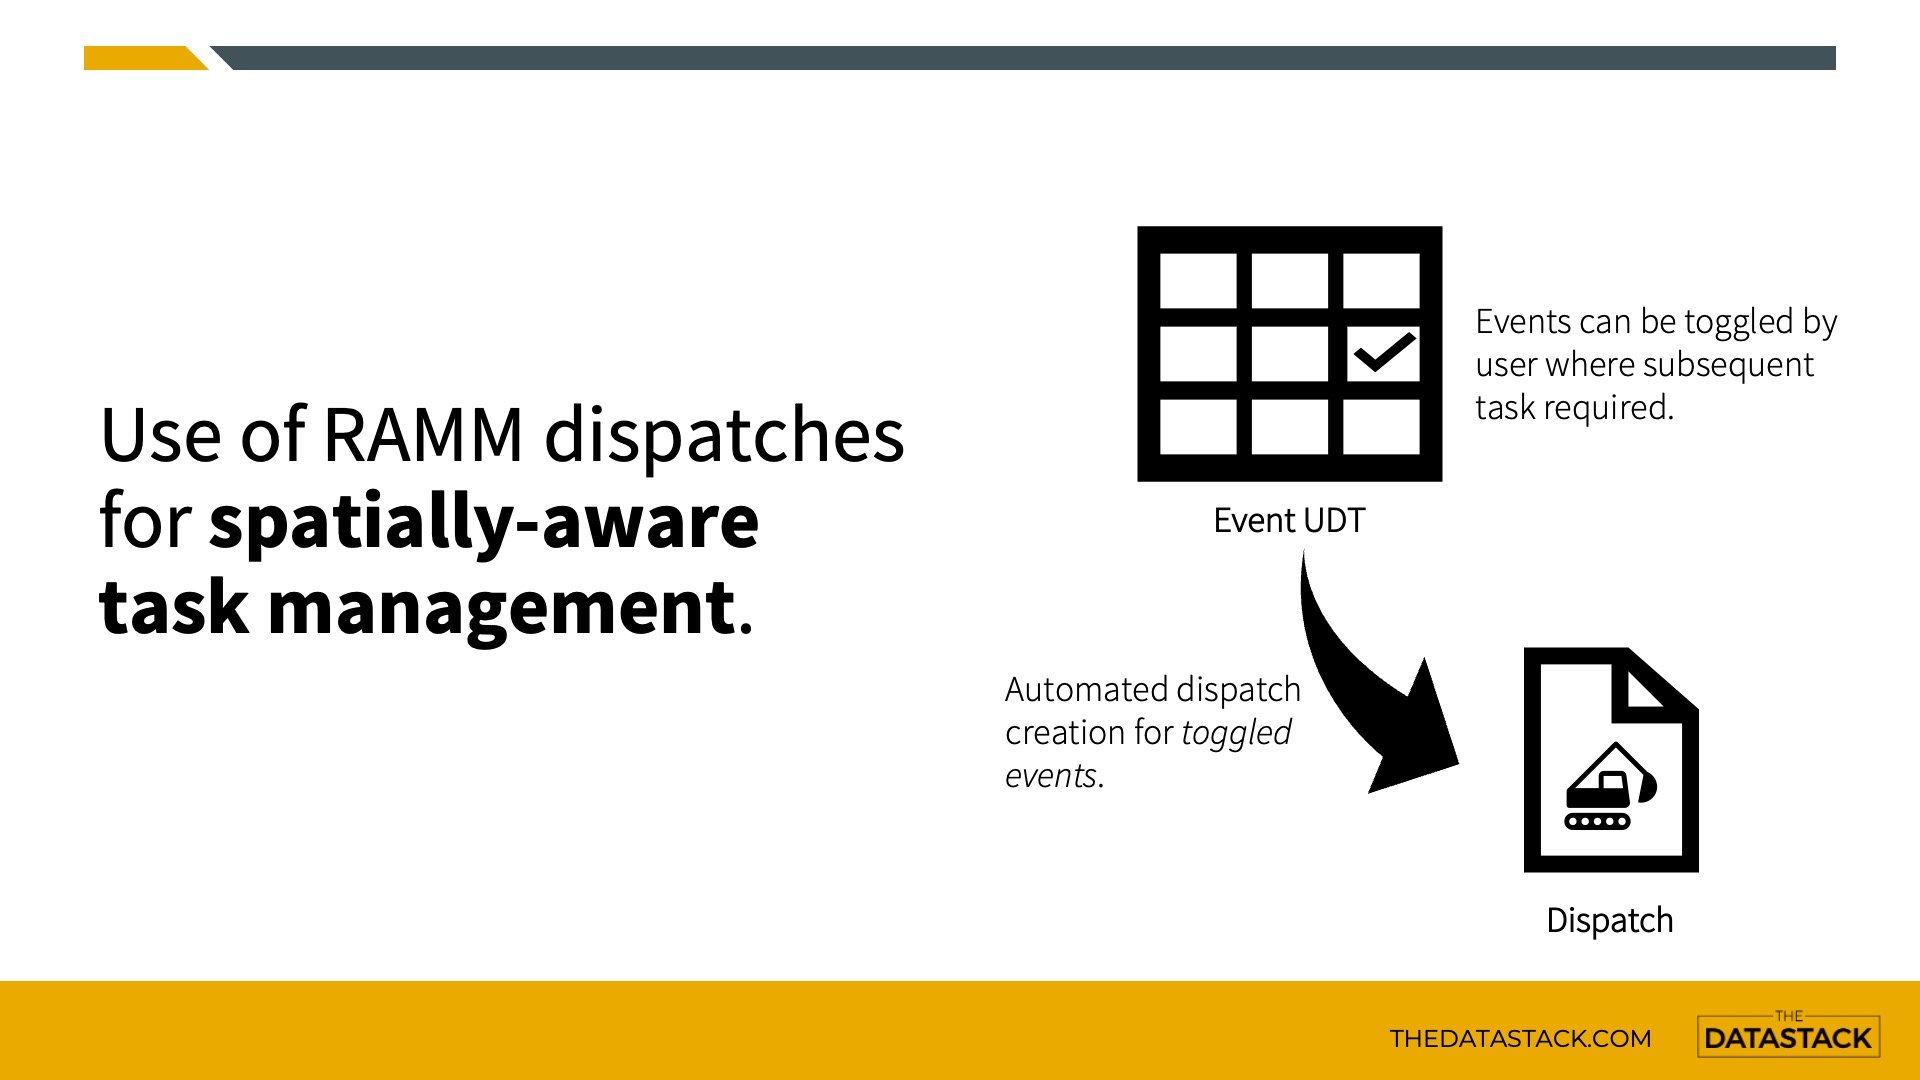
When follow-up actions were required for any of these events, the event could be flagged in the UDT.
A nightly process was then created to pick up all the new flagged events and generate a RAMM dispatch based on the event details.
This effectively created a workflow similar to a task management system, as the follow-up job was created as an actionable dispatch, with appropriate prioritisation and status tracking, all without leaving the RAMM environment.
Each month there was a reporting requirement to the RCA. Automated reporting outcomes were set up to run off the data. First was a proactive report identifying any items needing further review and closeout.
A second report was sent a few days before the formal reporting deadline, with all the fundamental attribution and reporting outcomes needed.
These were all relatively easy wins to achieve in RAMM. And the new set-up enabled the client to drop another piece of software they were initially using to manage these events, saving money on licensing costs.

So in wrapping up, please consider adopting the minimum innovation philosophy on your next project.
Perhaps that super flashy solution and all the downstream consequences that will come with it is not the most robust choice to make right now.
Perhaps you don’t need to throw out what you have working in place today, just to replace it with some sparkling new system or software.
Instead, using the foundations you already have and applying some tweaks and improvements around the edges may allow you to achieve some game-changing outcomes sustainably and cost-effectively.
Just a quick second about me. I am the founder and principal consultant at The Datastack, an asset management and digital solutions consultancy.
If you need to supercharge your data, I will help you do it.
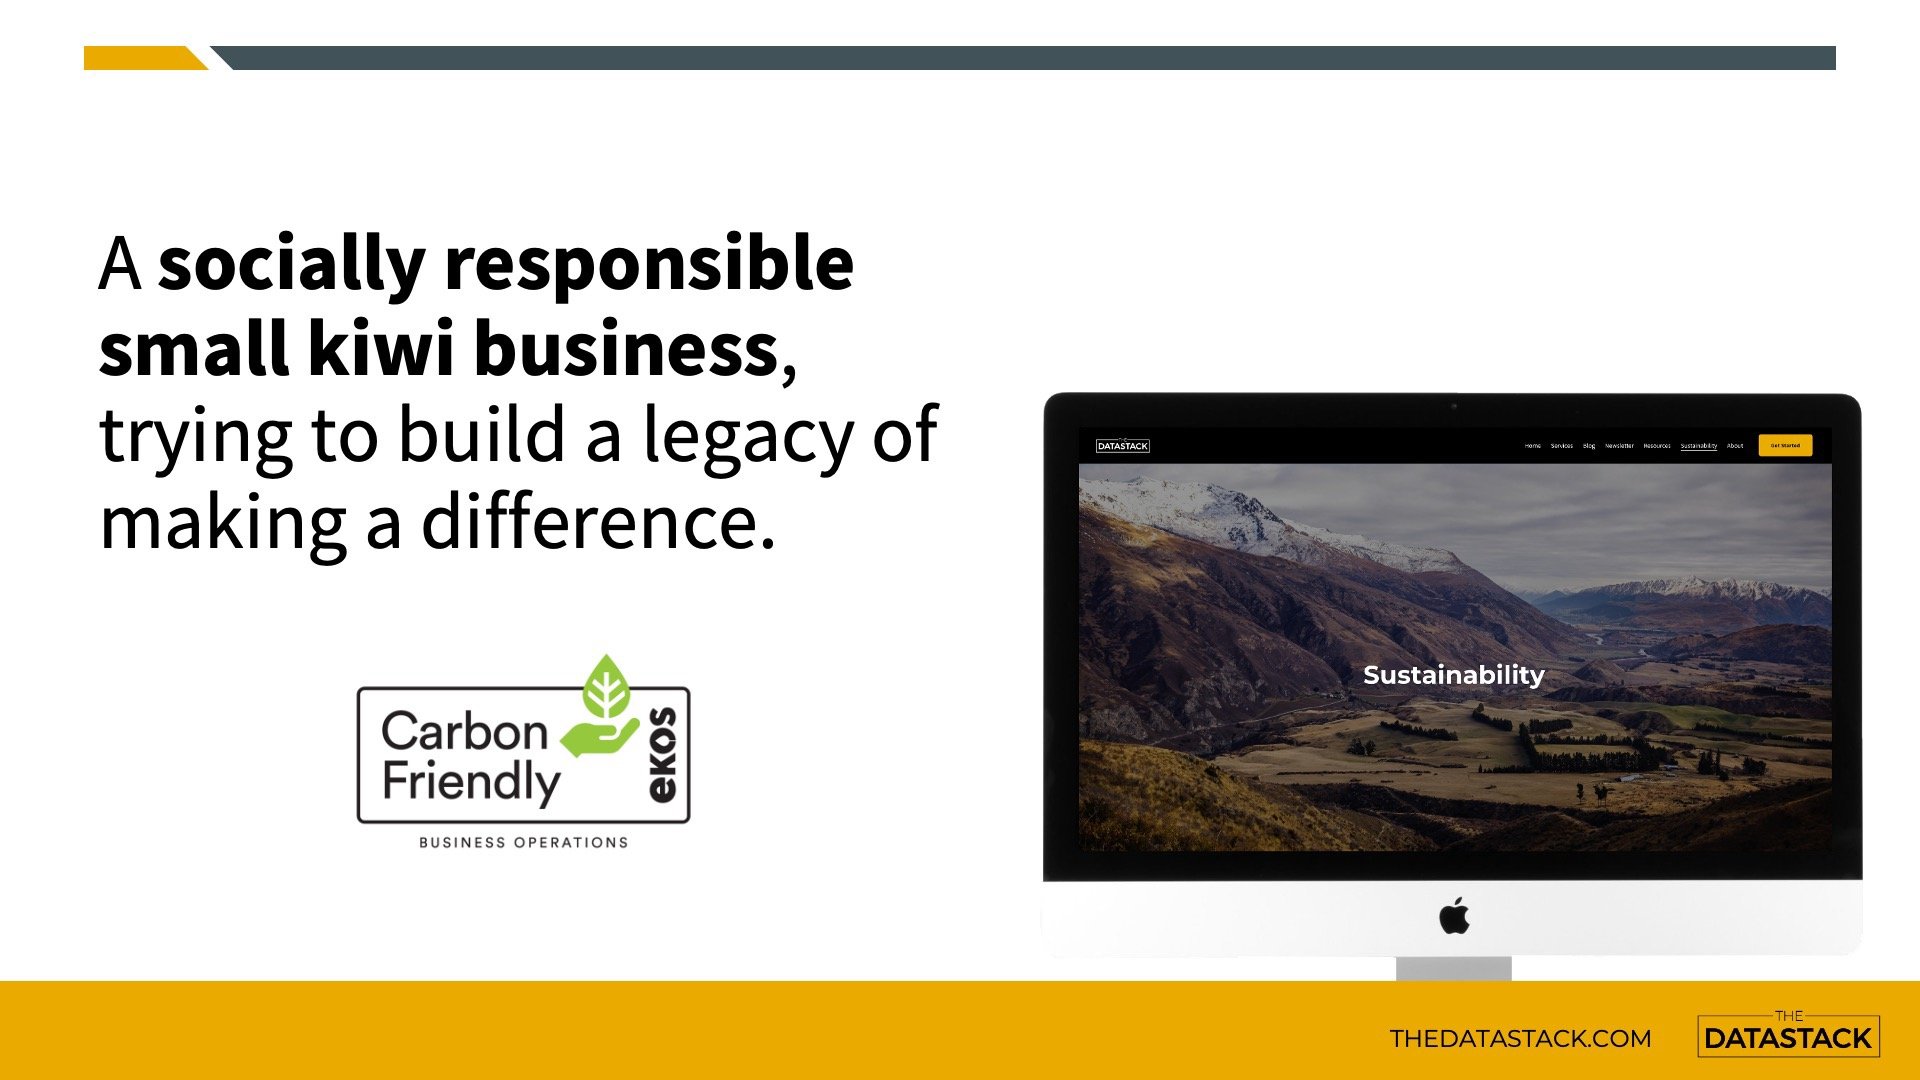
It’s important to me that The Datastack is not just about the day-to-day business stuff and achieving great things working together with my clients.
So, I try to make a difference through a sustainability policy featuring the three key pillars of;
being climate-friendly,
giving back to the community
and helping the sector with free resources
And speaking of free resources, if you want to learn SQL and how to use it in the new RAMM SQL Management application, you need to scan the QR code on the screen or click here.
At the link, you can sign up for SQL Basics for RAMM, a free and independent digital boot camp from The Datastack, to help kickstart your SQL journey today.

Finally, it is easy to stay connected with The Datastack. Simply scan the QR code on the screen now, or click here, to sign up for Stackable – my free monthly newsletter.
Thank you so much for your time! I appreciate you checking out this adaptation of my talk.